Header Goals Analysis in League 2 – Part 2
Continuing the header goals analysis from part 1, the set play header goals would be focused in this post. Note that all the goals data were updated to 3/1/2013 (same as part 1). The goal scoring patterns of header goals were different between open play and set play. The following diagram shows where the header goals were scored in set play.

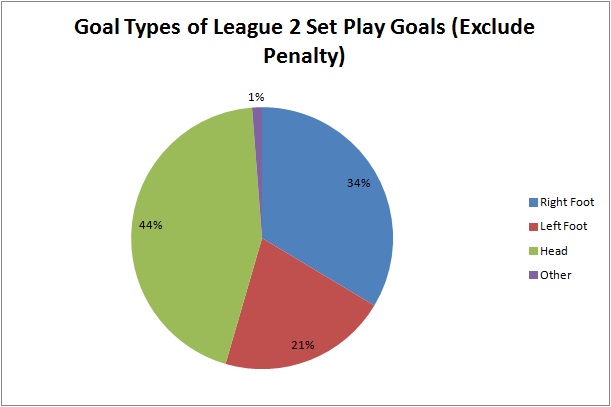
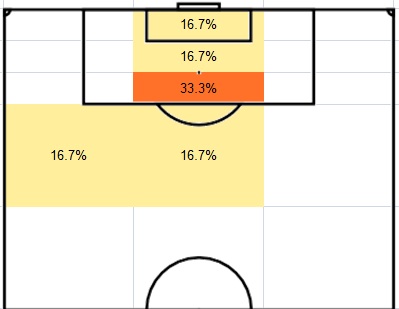
Figure 1: Where set play header goals were scored
If we compare this diagram with the open play version in part 1, two main differences would be found. Firstly, the prime header goals scoring area of set play was the 6-yard box. This finding was different to the open play, where 6-12 yard was the prime header goals scoring area of open play. Secondly, in set play all the header goals were scored within 12 yards from the goal line. In open play, there were still 3.3% header goals scored outside the penalty spot. It shows that scoring header goals in open play and set play needs two different tactics. In open play, the difference of percentage of goals between 6-yard box and 6-12 yard was not too big, only 5.4% difference. However, in set play the difference became 31.4%. In other words, in set play the player should focus on delivering the ball into the 6-yard box. Otherwise, the chance of scoring header goals would be greatly reduced but it was not the case in open play.
Corner Header Goals
Many people may closely link corner goals to header goals because they assume header goals should be the dominating goal types of corner goals. However, statistics shows that it was the case in League 2.

This chart shows that header goals were the main source of corner goals but it was not a dominating factor. If the coach only focuses on scoring by header in corner set play training, he is ignoring the importance of scoring by feet. It was because 52 corner goals were scored by feet. For example, scoring by rebound or picking up the second ball. In this post, we will focus on how those 59 header corner goals were scored.
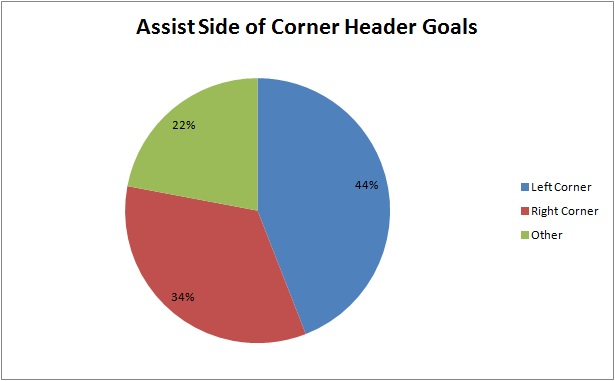
This chart shows that more corner goals were come from left side (44%) than right side (34%). The reason behind it was closely related to the types of delivery which would be discussed. This chart also shows that 78% (44%+34%) of corner header goals were directly assisted from corner delivery. The remaining 22% were come from short corner, header flick on or scoring in second phase of attack in corners. This finding shows the importance of getting the first touch in scoring corner header goals. The most effective way to score was the direct delivery.
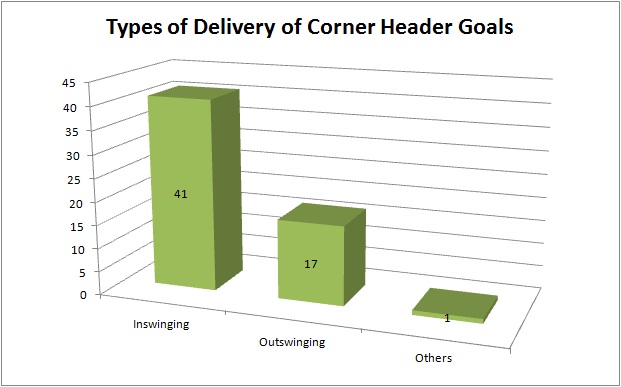
In terms of delivery, inswinging cross was the best way of delivery. 41 corner header goals were scored by inswinging cross but only 17 corner header goals were scored by outswinging cross. Moreover, it was not a good idea to use any other delivery method (e.g. short pass or pass to the edge of the box) because only 1 goal was scored by other methods. Since most of the corner header goals were delivered by inswinging cross, it explained that more corner header goals were come from left side considering most players are right-footed.
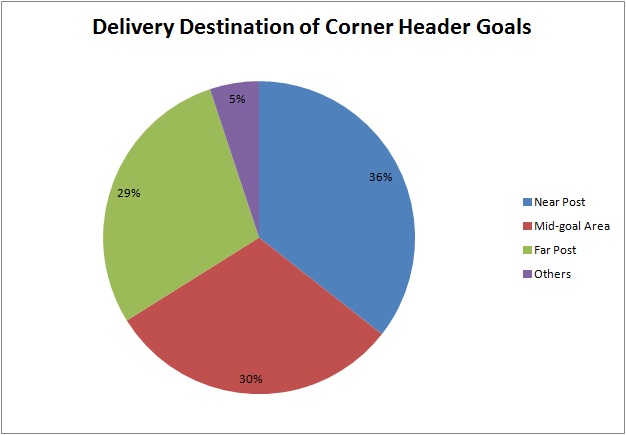
The area in front of the goal was divided into three different aim zones: near post, mid-goal area and far post. This chart shows that near post was the best place to be delivered to score corner header goals because 36% of goals were scored in near post. On the other hand, the percentages of mid-goal area and far post were similar (29% and 30%). The above two findings show that the inswinging corners delivered to the near post was the most effective way. It fits the argument of Hughes (1990) arguing that the theme that pays the highest dividend in corners is an inswinging corner to the near post in the book “The Winning Formula”.
Moreover, more than 90% of corner header goals were scored in the first phase. In other words, if the ball is cleared by defenders, the chance of scoring header goals would be greatly reduced even the ball is delivered into the penalty box again. By summing up the findings about corner goals, the best way of scoring corner header goals was to deliver inswinging corner from the left side to the near post and scored it in the first phase (first touch).
Free Kick Header Goals
Comparing with the corner goals, the header goals in free kick is less important which was shown in the following chart.

The most common goal type of free kick was to score by right foot. There were 32 header goals scored in free kick which was less than goals scored by right foot by 4.
The best delivery zone of free kick header goals was found by considering where the assists came from.

Figure 2: Where free kick header goals were assisted
Firstly, the zones just outside the penalty box were the better areas for delivery because 62.5% of free kick header goals were delivered from these three zones. Secondly, right flank was better than left flank because 50% of free kick header goals were delivered from right flank. By combining both findings, it can be concluded that the best delivery zones for free kick header goals were the zones outside the penalty box in two flanks, especially the right flank (21.9% in left and 37.5% in right).

In terms of types of delivery, inswinging delivery was still the best way, which is the same finding from corner header goals. However, it should be noted that the difference between inswinging (18 goals) and outswinging (11 goals) was much smaller in free kick than in corner. In other words, higher percentage of header goals was scored by outswinging delivery in free kick than in corner.

Mid-goal area was the dominating factor in the delivery destination of free kick header goals. This finding was different from that in corner. In corner, near post was the best area to be delivered but mid-goal area was the best area in free kick. Moreover, the difference was greater in this chart as there was 29% difference between mid-goal area (59%) and far post (30%), while the difference was only 6% in corner. That mean the advantage of delivering to mid-goal area in free kick was more obvious than delivering to near post in corner.
By summing up the findings about free kick, the best way of scoring free kick header goals was making an inswinging delivery to the mid-goal area from the zone outside the penalty area in right flank.
Conclusion
Scoring header goals in set play need a different tactic than in open play as the prime goal scoring area was different. Even in the set play goals, header goals had different importance to different set plays. Header goals were the most important in corner but less important in free kick. Moreover, the most effective way of scoring header goals in corner and free kick were different. Therefore, coaches should separate the training of corner and free kick since the tactical needs were different.
Reference
HUGHES, C., 1990. The Winning Formula. London: Collins
Share this:

Header Goals Analysis of League 2 – Part 1
How important are the header goals in League 2? Most of the goals are scored by right foot, left foot or head but they are not evenly distributed. Updated to 3/1/2013, there were 948 goals in League 2. 44% of them were scored by right foot, 25% by left foot, 21% by header and 10% of goals were scored by other parts of the body or by penalty. In short, around 1 out of 5 goals were scored by header. It fits the argument of Hughes (1990) saying that about 1 goal in every 5 overall was scored with a header in the book “The Winning Formula”.

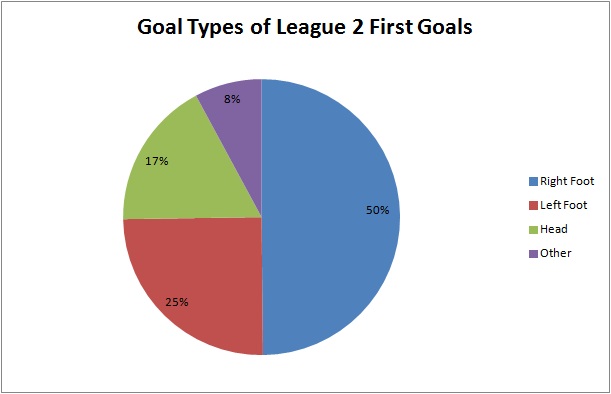
On the other hand, I explained the importance of first goal before so let’s look at the impact of header goal in League 2 first goals. There were 317 first goals and 17% of them were scored by header. That means it was less likely to score first goal by header while the impact of right foot was increased to 50%. It shows that attacking in header may not be a good choice to score first goal in League 2.
If we focus on the 200 header goals which is shown in the following chart, 54% of header goals were came from set play while 46% of them came from open play.

The above chart shows that header goals were scored more in set play (54%) than in open play (46%). Corner is the main source of header goals in set play, having 29% of total header goals. The importance of header goals is more obvious if the data is normalised by considering the total number of open play and set play goals.

There were 619 open play goals in League 2. The number of open play goals was more than that of set play goals. Even 46% of header goals were from open play, it only took 15% of total open play goals. It shows that the impact of header goals was not obvious because 84% of open play goals were scored by feet, particularly more than half (55%) were scored by right foot. It shows that if a team want to score open play goals, they should focus working more on their feet rather than header.
On the other hand, there were 244 set play goals (exclude penalty) in League 2. 54% of header goals were came from set play and it took 44% of set play goals. It highlights the importance of header goals in set play comparing with the situation in open play goals shown in previous chart. It gives a clue for the teams which are stronger at header. They should focus more on attacking in set play because it will give 29% more chance to score by header. However, it is worthy to note that even header goals were more important in set plays; it still took less than half of set play goals. In other words, more than half of the set play goals were scored by feet. It is very important for the practice of set play in training as they may only focus on attacking by headers. However, statistics show that the goals scored by feet in set plays were more than that by headers.
In this post, only open play header goals would be analysed. The analysis of set play header goals would be discussed next week because there are 3 types of set play (corner, free kick and throw-in) to be analysed.
Open Play Header Goals
Crossing was the main source of open play header goals because 85% of them were assisted by cross.

The remaining 15% were assisted by passing or shots. It indicated that there is a close relationship between crossing and header goals.
Some people may argue that the prime goal scoring area of header goal in open play is the 6-yard box because it is closer to the goal. However, it is not the case in League 2.
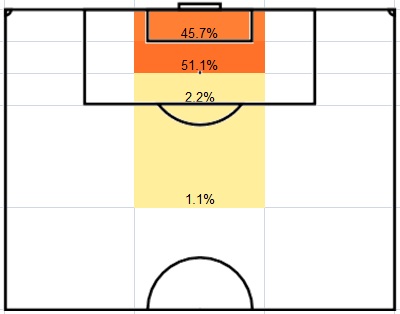
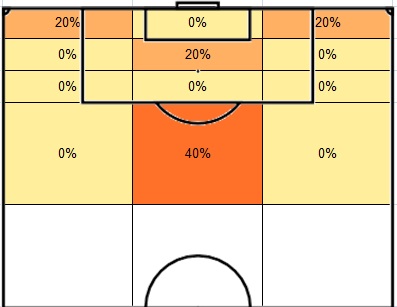
Figure 1: Where open play header goals were scored
The above diagram shows that more than half (51.1%) of the open play header goals were scored in the 6-12 yard area while 45.7% of them were scored in 6-yard box. It is similar to the argument of Hughes (1990). He argued that the “prime target area” extends out 8 yards, from 2 yards inside the 6-yard box to the penalty spot, and across 20 yards, the width of the 6-yard box. In this analysis, it shows that the prime scoring area of header goals is the 12-yard area from the goal to the penalty spot. For any header shots made behind the penalty spot, the probability of scoring decreased dramatically because only 3.3% of open play header goals were scored behind the penalty spot.
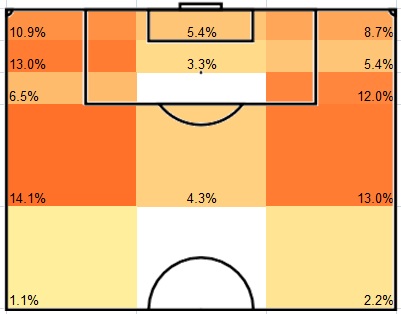
Figure 2: where open play header goals were assisted
From previous finding, crossing was the main source of assist to open play header goals. Therefore, it is not surprised to see that most of the assists were come from both flanks. Horizontally, there is not much difference between the right and left side which took 41.3% and 45.7% of assists. On the other hand, there were differences by analysing vertically. The assists made from the 18-yard area from the goal (65.2%) were much more than that from the zones outside the penalty area (31.5%). It is worthy to note that if the ball is delivered outside the final third of the pitch, it is much less likely to score by header because only 3.3% of assists were came from outside the final third of the pitch. If the delivery is come from the right side, the best delivery would be crossing from wide or deep because they took 12% and 13% of assist. The pattern would be different in the left side. Crossing near the goal line was better.
Conclusion
By combining the 3 points mentioned above, the best formula to score open play header goals in League 2 was found. It should be assisted by crossing. The ball should be delivered into the 12-yard area from the goal. The delivery area should be the final 18-yard area from the goal at both flanks. On the other hand, header goals were more important in set play than in open play. However, the importance of header goals should not be over-emphasised because over half of the set play goals were scored by feet.
The set play header goals would be analysed next week.
Reference
HUGHES, C., 1990. The Winning Formula. London: Collins
Share this:

Clean Sheets Analysis of League 2
A football game is all about attacking and defending. Therefore, keeping a clean sheet is as important as scoring goals. A team scoring a goal doesn’t guarantee any point but keeping a clean sheet guarantee at least one point and potentially getting three points. In this post, the defensive performance of League 2 teams would be discussed by analysing the clean sheets of League 2. Updated to January 28, there were 338 matches had been played, that means there were 676 team performances. Of these 676 team performances, 189 ended up with a clean sheet (28%). The teams produced 7.88 clean sheets on average. In these 7.88 clean sheets, 5.38 clean sheets led to wins and 2.50 clean sheets led to draws. On the other hand, clean sheets produced about 2.35 points per team and match on average.
The frequency of clean sheets is shown in the following chart.
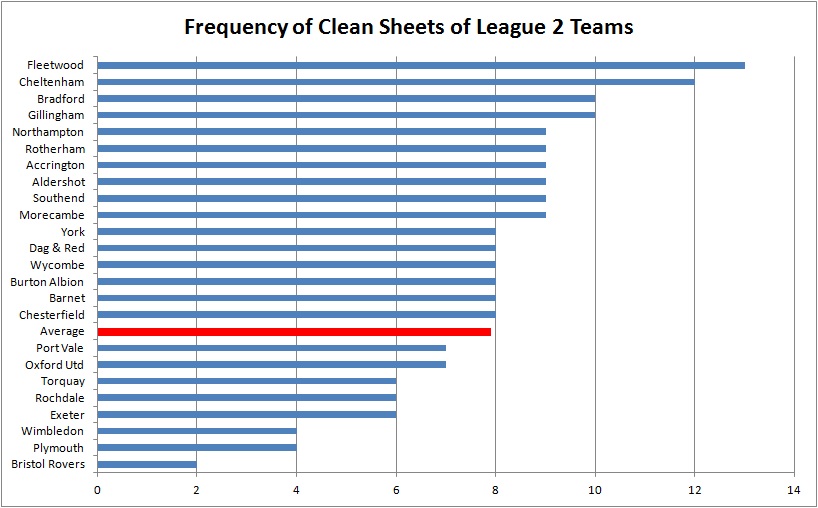
As shown in the chart, there is a huge range in abilities to keep clean sheets (from 2 to 13). Fleetwood and Cheltenham performed much better than other team, producing 13 and 12 clean sheets. Part of their ability to generate points has been their ability to produce good defence. In the top 4 clean sheet producers (10 teams), only Accrington, Morecambe and Aldershot are in the bottom half of the table. It indicates two results. Firstly, good at keeping clean sheets can lead to good league positions. Secondly, it suggests that defence is not the main issue of the above 3 teams. In order to improve their league positions, they should focus on improving their attacking. Moreover, the bottom 2 clean sheet producers are Bristol Rover, Plymouth and Wimbledon. They are the bottom 3 teams in the League 2 table as well which indicates the importance of keeping clean sheet. On the other hand, it shows how strong Port Vale’s goal scoring was. Port Vale only produced 7 clean sheets which are below average. However, they are at the top of the table which means the high number of goal scored can overcome the weakness of their defence.
Clean sheets were of different value for different teams. This is shown in the following chart.

Clean sheets had enormous value (3 points) for Exeter and Wimbledon. For every single match they held clean sheet, they won the game and got 3 points. Note that Wimbledon is at the bottom of the league table. That means the biggest problem of Wimbledon right now is the defence, not attack. On the other hand, Plymouth had the worst performance in the above chart. It shows that even Plymouth had kept clean sheet, they only managed to 1.5 points on average. Considering both charts, it means that Plymouth is having problems in both attack and defence. In the top 5 teams in this chart, 4 of them are in the top 6 of the league table. In other words, it’s not only keeping clean sheets that’s important, but also how the team managed to get points from clean sheets.
By combining both charts together, the teams can be analysed from another perspective which is shown in the following diagram.

In this chart, the two axes are the two average numbers (2.35 points gained and 7.88 frequencies of clean sheets). The objective of using two average numbers as the axes is to divide 24 teams into four quadrants showing different abilities. Firstly, Bristol Rovers, Plymouth, Torquay and Rochdale are at the bottom left corner. The characteristic of the teams in this quadrant is that they are both weak at producing clean sheets and getting points from clean sheets. The opposite quadrant is the top right quadrant which means the teams were good at producing clean sheets and got points from clean sheets as well. Gillingham was the best performer in this quadrant which means Gillingham had a good balance of attack and defence. On the other hand, the top two performers of keeping clean sheets were in the bottom right quadrant, they should focus on improving their attacking because it was the main issue hindering both teams from getting points from clean sheets. The same argument could be applied to Aldershot and Morecambe as well since they are at the bottom half of the league table. Port Vale didn’t show why they can be the top of league table in this chart because they were weak in producing clean sheets. However, their efficiency is better than Gillingham by getting more points per clean sheet game.
To conclude, keeping clean sheets is a strong indicator of a team’s defending ability. However, it’s not only keeping clean sheets that’s important, but also how the team managed to get points from clean sheets. Therefore, by dividing 24 teams into four quadrants showing different characteristics, we can understand why some teams are doing better than others and which aspects (attacking or defending) should be the main focus point for team improvement.
Share this:

“The Invincibles” Arsenal 2003-04 Analysis (3) – Henry-Bergkamp Partnership
What is the traditional 4-4-2 forward pair partnership? Marziali and Mora (1997) had an argument about that in the book “Coaching the 4-4-2”. They argued that one player play as “target man” who is physically strong and good at heading. Also, he is able to play with the opposing goal at his back. The other player is rapid, quick with good individual skill, who likes starting from a distance and moving all over the attacking front. As the forward pair in the invincible team, I argued Henry-Bergkamp partnership was one of the best in Premier League history but it was not a traditional 4-4-2 forward pair partnership because of their 3 features:
Feature 1: Separation of Duties
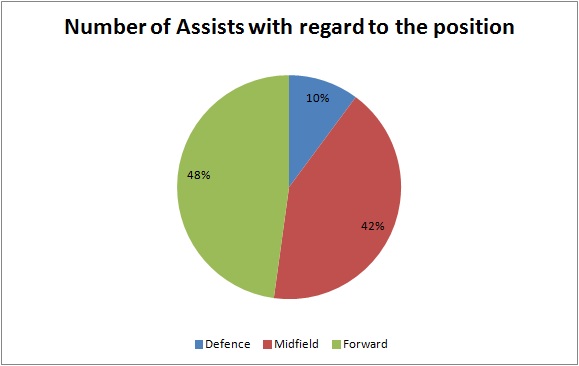
Henry was the focal point of attack and Bergkamp had supporting role. This is supported by two evidences. Firstly, Henry scored 70% of forward players’ goal (exclude penalty) as shown in the following chart. However, it must be clarified that Arsenal was not a one-man team.

Secondly, in terms of building up goals, Bergkamp was a more efficient player than Henry which I explained last week. On the other hand, they both contributed well in terms of assist.
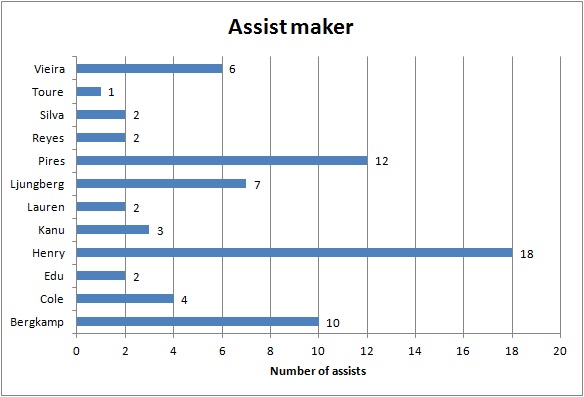
They were in the top 3 players in making assist. This forward partnership was so important in the team because they made 41% of team assists. If we consider the efficiency of making assist, their contribution is more obvious.
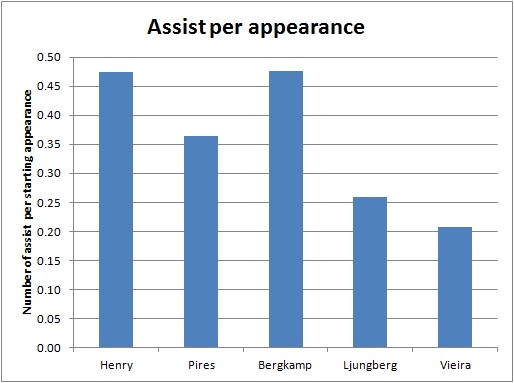
They were the top 2 most efficient assist makers in the team and Pires dropped to third. In short, Henry focused on scoring goals and making assists. Bergkamp focused on involvement of build-up of goals and making assists.
Feature 2: Different playing areas on the field
Henry played mostly at left flank and moved to central area to score goals. This argument was supported by two evidences by analysing where he scored goals and where he made assists. By considering open play goals, Henry scored 75% in central area (most inside penalty box) and 25% at left flank as shown in the following diagram.

This evidence is not strong enough so we have to analyse where he made assists as well to see where he played mostly.

Two results can be taken from this diagram. Firstly, Henry played mostly at left flank as he made 55.6% of assists on the left side comparing with 38.9% on the central area and 5.6% on the right side. Secondly, if we focus on the left side, you will realise most of his assists were made in the final 18-yard of left side (44.4% of total) while he only made 11.2% assists outside the penalty area on left side. The reason of it will be explained later in this post. Therefore, we can conclude that Henry played mostly at left flank and then drifted to centre of penalty area to score goals.
On the other hand, Bergkamp played more centrally than Henry and mostly spent his time outside the penalty area to provide support to teammates. As shown in the following diagram, Bergkamp made 70% of his assists outside the penalty area. His percentage of assists in central area and right side was more than that of Henry.

A comparative analysis could be made by making a table about where they made assists which shows their different playing areas.
| Henry | Bergkamp | |
| Final 18-yard area | 66.7% | 30% |
| Outside 18-yard area | 33.3% | 70% |
It supports my arguments above that Henry focused on playing left and scored in central penalty area while Bergkamp played more centrally and stayed outside penalty area in most of the time to provide support.
This is a video example showing their position. Even they both started on the left side, when the ball was moved to right side, Bergkamp tended to move to centre and Henry stayed at left flank until he moved to centre to score the goal in the penalty area.
Feature 3: Playing styles fit in each other
Henry was strong at attacking space behind the defence. This could be analysed by looking at the assists styles of Henry’s goals. Note that the goals from penalty and direct free kick were excluded.
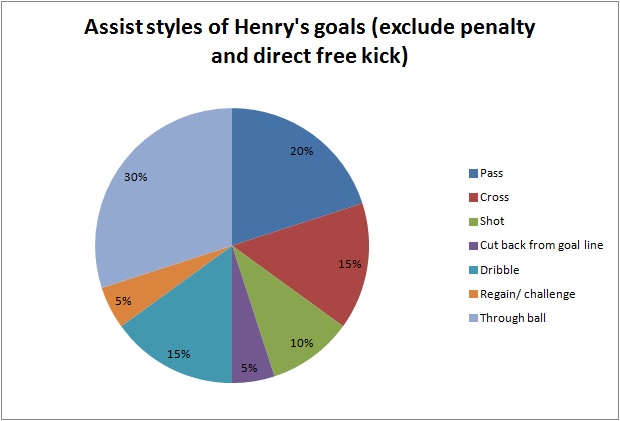
Three characteristics of Henry could be seen in this chart. Firstly, Henry was a striker who didn’t rely on crossing assist (15%). In a traditional 4-4-2 system, the strikers rely on the crossing from two wingers/wide midfielders but it was not the case in the invincible team. Secondly, he was good at exploiting space behind the defence because the largest proportion of his goals (30%) was come from through ball. It fits his styles as he was a fast runner. Thirdly, technically he was good because he could score goals by dribbling past his opponent (15%) and by receiving passes to his feet (20%).
Even both players contributed well in terms of number and efficiency of making assist, their assist styles were different. This is supported by two evidences. Firstly, Henry was strong at crossing.

33% of his assists were made by crossing. It can explain why 44.4% of his total assists were made in the final 18-yard area on the left side which is mentioned above. If you consider two evidences, 66.7% of his assists were made in final 18-yard area and 55.6% of his assists were on the left side, the final 18-yard area on the left side is the overlapped area which was Henry’s key playing area.
Bergkamp was strong at providing through ball (penetrative pass to the back of defence).
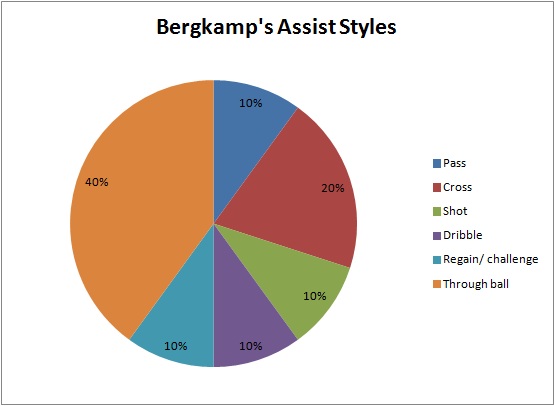
The result of Bergkamp’s assist styles is more obvious than that of Henry. 40% of his assists by made by through ball. It fits the previous finding that Bergkamp tended to play outside the penalty area providing support.
The different playing styles of these two players brought out two main benefits. Firstly, they provided variety of assist styles to benefit the team based on their strengths. Secondly, Bergkamp’s assists style (through ball) fits Henry’s goal scoring style (attacking space behind the defence) perfectly. This is shown in the following video example:
In conclusion, I would like to use a table to summarise my analysis.
|
Henry |
Bergkamp |
|
| Separation of duties | Goal scoring + making assist | Build-up of goals + making assist |
| Playing areas | Left flank + final 18-yard area | More central + Outside penalty box |
| Playing styles | Attacking space behind defence + crossing | Playing through ball |
Their partnership was not a traditional 4-4-2 forward pair partnership. I argued that it was still an excellent partnership in Premier League’s history because they fitted in each other based on their strengths.
Reference:
MARZIALI, F. and V. MORA, 1997. Coaching the 4-4-2. Spring City: Reedswain
Share this:

“The Invincibles” Arsenal 2003-04 Analysis (2) – Were Arsenal a one-man team?
No doubt, Henry was the most important player in “the invincible” squad. However, were Arsenal a one-man team in 2003/04 season? This question would be analysed in this post. As the top goal scorer in the team, Henry scored 41% (30) of the team goals (73) in that season.

As shown in the above chart, Henry absolutely outperformed other players in terms of goals. Apart from Henry and Pires, nobody else scored more than 4 goals. Probably the best striker in the world at that time, Henry was able to do something different comparing with other strikers. For example, a target man needs crosses provided by teammates. A poacher needs through ball or penetrative pass. However, when somebody gave Henry the ball, he had the ability to do the rest by himself. For example, the following video shows how good his dribbling was.
In this goal, the assist was made by Henry as well because I will code it as “self-assist” if the goal scorer scored the goal by beating opponents by dribbling. My definition of “one-man team” is that the team is heavily (or just) relying on the performance of certain player. Was that the case in the “invincible” squad? The above evidences and examples may suggest a “yes” but I argue Arsenal were NOT a one-man team because of three reasons.
Reason 1: Pires was an efficient and reliable goal scorer also
There were seven penalty goals which were all scored by Henry, so it would be fair to take them out and look at the goal distribution again.

Henry’s 23 goals took 35% of the team goals. As shown in the chart, there was a second reliable goal scorer in the team as well. Pires scored 14 goals which were 21% of the team goals. Apart from analysing the number of goals, the efficiency should be considered as well. The top 5 goal scorers in the team were taken out. Their number of goals were normalised by considering their number of starting appearance as well.

Henry was still the most efficient striker, scoring 0.61 goals per appearance. The goal scoring efficiency of Henry and Pires were much better than the rest of the team. The above two charts show that in terms of goal scoring, Arsenal were not only relying on Henry due to the presence of Pires who was a efficient and reliable goal scorer as well. When the position of the goal scorer was considered (own goals were taken out), it further supports my argument.

The forward players scored the most (33 goals) which was 53% of the team goals. However, it also shows that the midfield of Arsenal was a strong goal scoring force by scoring 44% of the team goals. I agreed that the forward players heavily relied on Henry who scored 23 out of 33 (70%) forward players’ goals. However, it was not the case for the whole team.
Reason 2: The responsibility of making assist were shared by several players
Apart from being the top goal scorer of the team, Henry was also the top assist maker as well, making 18 assists in that season. Only 3 of them were self-assist by dribbling past opponents before he scored. However, Henry’s effect was not as obvious as shown in the goal chart because he took only 26% of the team assists.

The chart shows that the responsibility of making assist was well shared by several players. The most obvious top 3 assist makers were Henry (26% – 18 assists), Pires (17% – 12 assists) and Bergkamp (15% – 10 assists). This chart could be analysed in two perspectives. Firstly, Arsenal had a good strikers’ partnership of making assist. Although Bergkamp hadn’t scored many goals (4), his contribution in making assist was obvious. The Henry-Bergkamp partnership took 41% of the team assists. Secondly, the 6th assist maker was Cole who was a left back. Considering the left side combination (left back, left midfielder, left forward), the Cole-Pires-Henry combination took 49% of the team assists. That means for every two goals Arsenal scored, one of them was assisted by one of the left trio. It shows how strong the left side of Arsenal was (I will write a post for this topic in future). The above two evidences show that even Henry was a world-class player, there were some top players playing with Henry at that time. By considering the position chart, it shows that the effect of forward players in making assist was not as strong as goal scoring, decreasing from 53% to 48%.
The contribution of defenders increased a lot from 3% in goal scoring to 10% in assist making, while midfielders had a more or less same percentage (44% and 42%).
Reason 3: Henry was NOT the most efficient player in building up goals
Looking at the assist can only give a clue about the final pass; it doesn’t show you the build-up of the goal. In order to analyse the players’ contribution in the build-up of the goals, the players involved in the goals have to be considered. Note that the set play goals were excluded in the following charts.

Only the top 6 players were shown in this chart. In 52 open play goals, Henry was involved in 35 of them (67.3%). There is a little gap between the top 2 players (Henry – 35, Pires – 30) and the other players. It shows that Henry and Pires were still the two key players in Arsenal’s build-up of goals. Similar to the assist chart, Bergkamp got the 3rd position. However, in the starting line-up of Arsenal, Bergkamp had the least starting appearance (21) comparing with Henry (38) and Pires (33). It shows another picture when the appearance was considered to normalise the data.

In fact, the overall trends of two charts are very similar but Bergkamp’s performance and efficiency was the best when the data were normalised with number of appearance. For every single starting appearance, Bergkamp was involved in building up at least 1 goal. On the other hand, the difference between Henry and Pires became much less (only 0.01) which imply that their efficiency were pretty much the same. With the age of 34 in that season, Bergkamp didn’t play as much as before and wasn’t the focal point of attacking. However, with his high level of technique and vision, he still played a key role in building up the goal even he was not the person to make the assist every time. The following video is an example to show Bergkamp’s vision and technique to pass a “killer ball” penetrating two lines of defence.
To conclude, there is no doubt that Henry was a key player in the “invincible” squad. However, Arsenal were not a one-man team because other players played key roles in different aspects. Pires provided efficient and reliable source of goals. Cole had a great contribution of making assist. Moreover, Cole played a key role in assisting Pires and Henry in the left side because the combination of these three players took half of the team assists. Although Bergkamp didn’t contribute much in scoring goals, his contribution was mainly focused on assist and build-up of goals. He was the most efficient player in building up goals.
Share this:

“The Invincibles” Arsenal 2003-04 Analysis (1) – Squad and formation
Arsenal 2003/04 unbeaten title-winning team have been voted as the Best Team in the Premier League’s 20 seasons awards. It is the first team to win the Premier League title having not lost a game. The last team to achieve it was over a hundred years ago. It was a big achievement that earned the nickname “The Invincibles”. Therefore, it is worthy to analyse this team to see what we can learn. How did they play? What were the characteristics of the players? It may not have the best players in every position but the chemistry they formed was the best at that time. I am trying to find it out through analysing the 38 league games.
Arsene Wenger used 22 players in the whole season. However, Justin Hoyte and David Bentley had only made 1 appearance, comparing with the rest of the team making at least 9 appearances (more than 20% of the 38 games). Therefore, it is reasonable to exclude these two players and focus on how Wenger used those 20 players in the whole season. This was the first team line up:

Goalkeeper Jens Lehmann played every league game in the whole season.
Defenders:
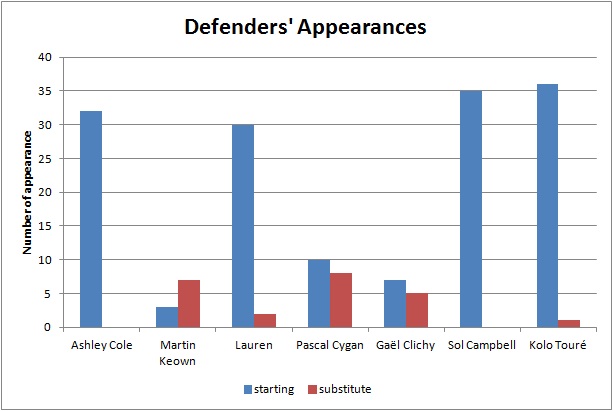
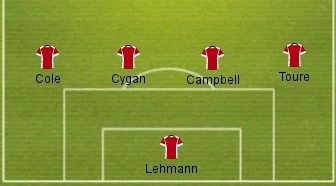
The above chart clearly shows that Cole, Lauren, Campbell and Toure were the first team players of the back four. Keown had more substitute appearances (7) than starting appearances (3); especially four of them were in the last four games after Arsenal had won the title on 25/4/2004. Therefore, Cygan was the first choice back up in the centre back position. On the other hand, Clichy was the back up of Cole in left back position. Who was the back up of Lauren in right back position? Wenger used a different approach. Instead of putting a right back player as the backup of Lauren, Wenger used the versatile Toure wisely. The following diagram shows Wenger’s approach about the backup of right back. When Lauren was not available, Wenger moved Toure to the right back and let Cygan played as centre back:
 Even Toure moved from a centre back to a right back, he was more than a defensive right back. His speed and strength made him playing well as an attacking right back also. The following video is an example.
In short, the versatility of Toure gave the consistency in Arsenal’s defence, letting Wenger used 6 players mainly throughout the season.
Midfielders:
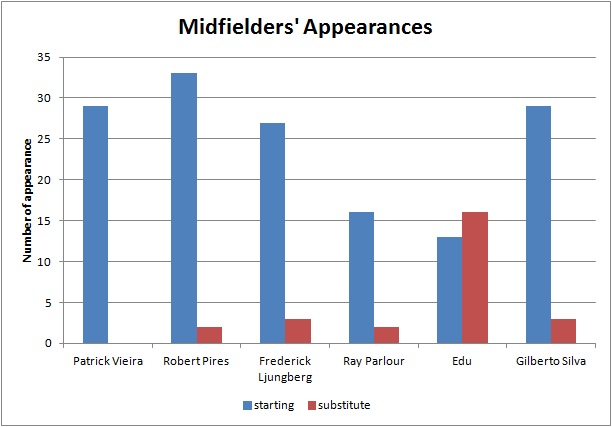
The chart of midfielders is not as obvious as that of defenders. It shows that more rotation was happened in midfielders. However, it still shows that Vieira, Pires, Ljungberg and Silva were the first team midfielders. Edu shouldn’t be ignored because he was Wenger’s first choice substitute in midfield, having 16 substitute appearances. In fact, if total appearances were considered, Edu had 29 (13+16) which is the same as Vieira.
Only 6 midfielders were mainly used in the whole season showed the versatility of these players, especially the two backup players Parlour and Edu who played as both central and wide midfielders. Moreover, Pires and Ljungberg were able to play at both flanks. The combination of these 6 players gave the flexibility and consistency of a solid Arsenal midfield.
When Ljungberg was not available, Parlour was the first choice of Wenger to replace the right winger role:

When these two players were not available, Pires played as a right winger as Edu played as a left winger:

It happened 4 times during the season. However, Wenger used a different approach in the late second half of the season, keeping Pires as left winger and put Wiltord or Reyes as the right winger.
When Pires was not available, Wenger moved Ljungberg to the left and played Parlour as the right winger:

If both Pires and Ljungberg were not available, Edu could play as a left winger also.
The rotation in central midfield was simple. Parlour and Edu were the backup of Vieira and Silva. However, the interesting point is that even Edu was the first choice substitute in Wenger’s mind; Parlour was the primary backup central midfielder when either Vieira or Silva was unavailable. There were 18 games when one of them was unavailable, Parlour started 11 of them and Edu started only 7 of them.
The appearances and rotation in midfield could be linked to the analysis of formation. In 4-4-2, the central midfielder substitutes were still able to cover the wide position as wide midfielder or winger (e.g. Parlour in right flank, Edu in left flank). It is because the two strikers playing upfront are the main goal scoring power. The substitutes could act as a supporting role in wide position even though they are not good at attacking. Comparing with the 4-3-3, 4-5-1 or 4-2-3-1 nowadays, it is rarely to see a central midfielder to take over the winger position because the winger position in these formations requires more attacking attributes due to the lone striker system.
Strikers:

Henry was definitely a first team member starting all 38 league games. Therefore, what Wenger had to decide is using whom as Henry’s partner. Wiltord got more chances firstly. In the first 10 games, he started 5 times and played 3 times as substitute. However, he was not in Wenger’s first team plan since then. Bergkamp, having 21 starting appearance, was the partner of Henry in most of the season. However, may be because of Bergkamp’s age, he didn’t play many games continuously. Wenger used Kanu, Aliadiere and Wiltord as the backup. The situation changed after January’s transfer window. Reyes joined the team and got the chances immediately. The total number of games Reyes played in half season (13) was more than Wiltord (11), Kanu (10) and Aliadiere (9) playing in the whole season. Note that in some exceptional cases, Wenger used Reyes and Wiltord as left and right wingers.
For further analysis of Arsenal invincibles squad, please go to the links below:
Part 2 – Were Arsenal a one-man team?
Part 3 – Henry-Bergkamp Partnership
Part 4 – Henry, Pires and Cole
Share this:

Analysis of top 4 strikers in League 2 (2)
The analysis is continued following the first part last week (here). In the shot analysis, when treating unequal frequencies of starting appearances, the data are “normalised” by dividing the data by the frequency of starting appearances.
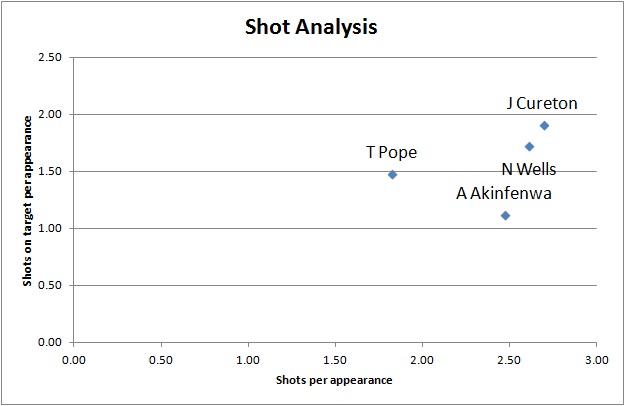
Although the other three strikers have at least 2.5 shots per appearance, T Pope had only 1.83 shots per appearance which is significantly lower than others. In terms of getting shot chances, T Pope is weaker than the other three strikers. On the other hand, A Akinfenwa showed his weakness as he only got 1.12 shots on target per appearance. N Wells and J Cureton are similar, both getting high number in shots and shots on target. Even T Pope got less chance to shoot; he still managed to get 1.48 shots on target which means he utilise the chances well. If you look at this chart only, you may wonder why T Pope is the leading goal scorer in League 2. It is all because he is particularly strong at catching the chances even the chances he get are less than others. This brings us to the next analysis chart: Accuracy rate vs Conversion rate.
Accuracy rate = no. of shots on target / no. of shots total
Conversion rate = no. of goals / no. of shots total
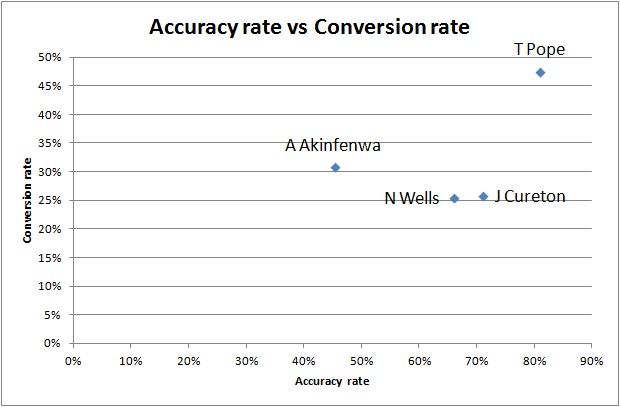
T Pope is outperforming others in this chart in both rates. In previous chart, N Wells and J Cureton showed they got more chances to shoot and they did well in number of shots on target. It is reflected in their decent accuracy rate (66% and 71%). However, conversion rate is their weakness (26%) and it explains why they can’t be the leading goal scorer even they got more chances. T Pope’s conversion rate (48%) is 22% more than them. A Akinfenwa did well in conversion rate (31%) but he is weak at accuracy rate (45%). From the above two charts, you may realise N Wells and J Cureton are so similar. They both good at getting shooting chance, have a decent accuracy rate but weak at converting chances into goals. T Pope is another type of striker who is highly efficient. A Akinfenwa strike a balance between both types.
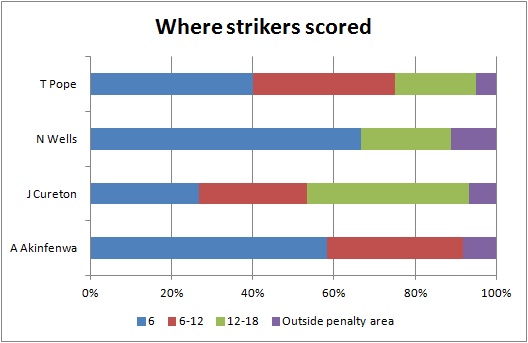
In analysing where the strikers scored, we can find out other characteristics of the strikers. A Akinfenwa is weak at long shot because only 8% of his goals were scored outside 12 yards from the goal line. It is reasonable if we combine the finding last week suggesting that he is strong at scoring by headers and in set play. N Wells is strong at scoring in 6-yard box (67%). Last week, we found out that he hasn’t scored any goal by header. If we combine both together, I guess that his goal scoring style is like “poacher” to catch the chances in 6-yard box by using his agility rather than strength. T Pope and J Cureton had a good balance in goal scoring area with T Pope stronger at 6-yard box and J Cureton stronger at 12-18 yard area.

This chart fits our finding beforehand. A Akinfenwa is strong at heading and he scored 92% of his goals within 12-yard area from goal. It is reasonable to see that he scored all goals by using 2 touches or less. N Wells fits his “poacher” style by scoring all his goals using 2 touches or less. In terms of using 3 touches or more, T Pope had the highest percentage (20%). If we combine our finding of his high conversion and accuracy rate, it can somehow show his composure in front of the goal by getting the best chance to score.
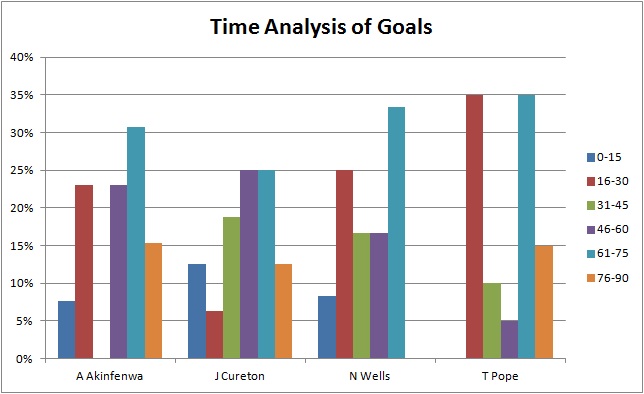
We can find out the strikers’ particular goal scoring pattern by using time analysis. Firstly, A Akinfenwa is much stronger in second half, only 31% of his goals were scored in the first half. Note that 46% of his goals were scored in the last 30 minutes of the game. This may be explained by his strength and strong header to attack at the end of the game. N Wells haven’t scored any goal in the last 15 minutes of the game. It is reasonable if we sum up the previous findings. Usually there will be direct style and long ball in the last 10-15 minutes if a team is losing, but N Wells is not the same type of striker like A Akinfenwa. N Wells is strong at feet and agility rather than header and strength. T Pope’s goal scoring pattern is interesting. 70% of his goals were scored in the mid 15 minutes of the halves. Only 5% of goals were scored in the first 15 minutes of the halves. He may need time to “warm up” in the game before showing his goal scoring power. Then we move on to the assist analysis to see how the strikers’ goals were assisted.

J Cureton is stronger than others in dribbling which can create the scoring chance himself. A Akinfenwa and N Wells have no dribbling goals, that means they heavily rely on the support from teammates because they can’t create chances themselves. It is reasonable if we refer back to the characteristics of these two strikers. N Wells is strong at scoring in rebounds because 25% of his goals were assisted by teammates’ shots. It fits his “poacher” style mentioned above. Moreover, none of his goals were come from crossing. Surprisingly, only 20% of T Pope’s goals were assisted by passing. He relied on crossing (40%) more than other strikers. Then we analysed where the assists were. Please note that only open play goals assists were shown in the following diagrams.
A Akinfenwa:
As I mentioned last week, A Akinfenwa is strong at headers and set play. This diagram shows that his headers goals were heavily linked to set play. Therefore, only 40% of open play goals assists were from the flanks.
J Cureton:

J Cureton’s goals were mainly assisted from the right flank and centre. If any team play against Exeter, they should pay more attention to defending at their left flank (particularly from 12 yard to outside the penalty area) because 35.7% of J Cureton’s goals were assisted from these two zones.
N Wells:
This diagram further supports my previous arguments about the characteristics of N Wells. He is strong at agility and feet, weak at headers and strength. He plays like a “poacher” but none of his goals were come from crossing. Therefore, this diagram is under expectation that 83.3% of assists came from centre. By using this diagram, we know more about how he scored. 33.3% of assisted were from 12-18 yard area. If we combine this with the previous findings:
- 67% of his goals were scored in 6-yard box
- 50% of assists were passing, 25% of assists were shots
- 89% of goals were scored by feet
- 100% of goals were scored by 2 touches or less
We can figure out a full picture how he scored open play goals: his teammates attack through middle of the pitch, making a pass or take a shot (particularly 12-18 yard area). If it is a pass, he would at most take one touch before the shot. If it is a shot, he would take the rebounding chance in the 6-yard box.
T Pope:

From last week’s finding, T Pope is an all-round striker. He is good at scoring by right foot, left foot and header as well. Even in this assist diagram, the assists covered a wide range of areas. These make defending the leading goal scorer a difficult task. However, it is still a useful tip to find out that 41.3% of assists came from centre.
I think the whole analysis process covers enough details to find out the characteristics of the strikers. This is the end of the striker analysis. I may make a review about striker analysis at the end of the season.
Share this:

Analysis of top 4 strikers in League 2 (1)
Different strikers have their own characteristics in scoring goals. They can somehow reflect their teams’ goal scoring characteristics as well. We will focus on the top 4 goal scorers in League 2. The analysis is quite long so I divide it into two posts. The second part will be continued next week. The following table shows who they are, their team and the position in league table. Please note that all the data is updated to 28/12/2012.
|
Name |
No. of goals |
Team |
Team league position |
|
T Pope |
20 |
Port Vale |
2nd |
|
J Cureton |
16 |
Exeter |
10th |
|
A Akinfenwa |
13 |
Northampton |
11th |
|
N Wells |
12 |
Bradford |
5th |
It seems that being a top team does not necessarily need a top goal scorer as only 2 of the top 4 strikers are playing for a team in the top 7 of the table which is the promotion playoff line. The other 2 strikers are playing for the teams in the mid-table position. However, I agree that a high quality striker can bring an average team into a top team.

Although T Pope is the top goal scorer, he doesn’t have the highest percentage of team goals. J Cureton is the striker whom the team relies on the most because he scored 47% of the team goals. It is worthy to note that all 4 strikers scored more than one-third of the team goals.
Apart from looking at the number of goals, we should analyse by looking at the starting appearance as well in order to understand the efficiency of the strikers.

As the top league goal scorer, T Pope is the most efficient striker as well. He scored 0.87 goals per starting appearance. Note that J Cureton scored more goals than A Akinfenwa but A Akinfenwa is more efficient because he scored slight more goals than J Cureton in terms of goals per starting appearance.
We discussed how important the first goal before (here) so it is worthy to analyse the strikers’ ability to scored the first goal in the match.

A Akinfenwa performed much better than other strikers in terms of first goal. 46% of his goals were first goal, which is obviously higher than that of T Pope (30%) and J Cureton (31%). His percentage of first goal is almost double the percentage of N Wells (25%). This is A Akinfenwa’s strength and people may ignore it if we don’t analyse the strikers from this perspective.
Then we move on to analyse the relationship between open play and set play goals.
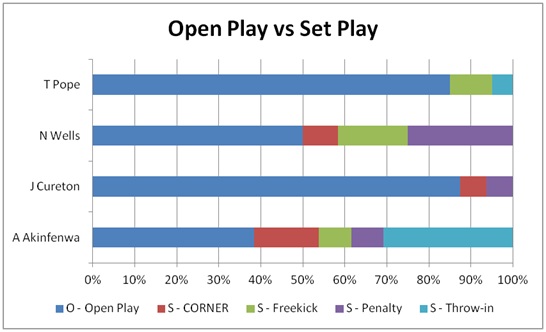
T Pope (85%) and J Cureton (88%) scored most of their goals in open play, obviously higher than the percentage of other two strikers. N Wells struck a balance by scoring 50% open play goals. However, 25% of his goals were come from penalties. A Akinfenwa is particularly strong at scoring set play goals as 62% of his goals were from set play. Note than 31% of his goals were from throw-in which is much higher than other strikers. Moreover, he scored the highest percentage of goals in corner (15%) as well. He is a good example showing that the team top goal scorer can reflect the goal scoring characteristic of the team. Northampton scored more goals in set play (53%) than open play (47%). In all 18 set play goals, 50% of them were came from throw-in. The goal scoring pattern of Northampton and A Akinfenwa is almost the same even he scored only 35% of team goals.
Then we will analyse how the strikers scored the goals.
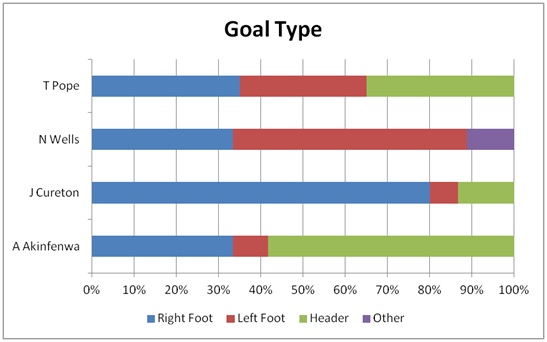
Note that I have excluded the goals from penalty in this chart. T Pope shows he is an all-round striker and this may explain why he is leading goal scoring table. The goals he scored by using his right foot (35%), left foot (30%) and head (35%) were almost evenly distributed. J Cureton is particularly strong at scoring goals by right foot (80%). However, it can be treated as a weakness as well because it is easier for the defender to mark him. N Wells is weak at header as he hasn’t scored any goal by header. However, he is strong at scoring goals by using both feet. A Akinfenwa is strong in air as he scored 58% of his goals by head. It fits what we find that he scored the highest percentage of goals from set play (62%) among 4 strikers, particularly in throw-in (31%) and corner (15%). In short, scoring goals by header in set play is the strongest weapon of A Akinfenwa.
The analysis will be continued next week by analysing these 4 strikers from different perspectives including where they scored, when they scored, where assist came from, assist types, shots total and shots on target.
Share this:

League 2 result analysis: how hard to hold the leads?
If a team scored the first goal in the first half and hold it until the end of first half, what does that mean? How big is the chance to win that game? Or is there any chance for the opposition team to win it back? How big is that chance? What are the differences in holding 1 goal and 2 goal differences in terms of the percentage of chance to win the game finally? Are 2 goal differences safe enough to win a game? The follow analysis will answer all the questions above by analysing the league 2 result this season (updated to 20/12/2012).
I have compared the half time results with full time results and built a connection between half time leads and full time results by using the goal difference.
 When the game was tied at half, there was a 42% chance to have a draw at the end of the game. In other words, there was a 29% chance that one of the two teams won the game finally.
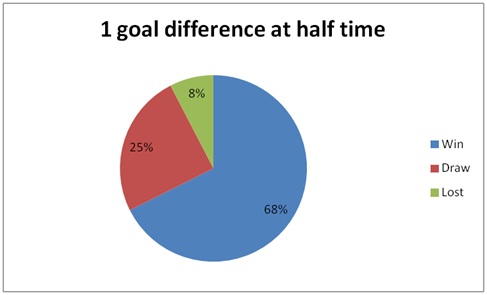
However, if a team is leading by 1 goal at half time, the chance of winning the game increased significantly from 29% to 68% which is a pretty high chance. It is worthy to note that it still had a 8% chance to lose the game even the team had a 1-goal lead at half time. That’s why so many people claimed that the team need a “two-goal cushion” to get the three points. Is “two-goal cushion” a three-point guarantee in league 2? We are going to find out.
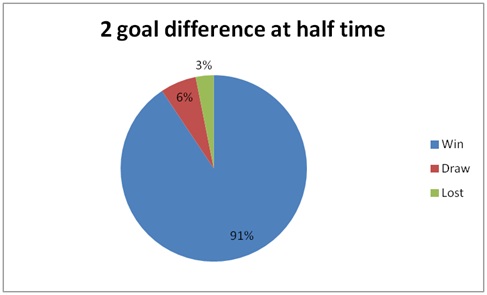
When a team was leading by 2 goals at half time, the chance of winning the game increased from 68% to 91%. In other words, it was not a 100% guarantee yet because 6% of teams managed to get a draw finally. Surprisingly, there was still a 3% chance that the leading team eventually lost the game. In short, there was 1 out of 10 chances that the leading team can’t get the three points at the end of the game. The “two-goal cushion” may not be as safe as people thought in League 2.

However, once a team was leading 3 goals at half time, the match is over. No team could manage to get a draw or win it back if they are losing at a 3-goal margin at half time.

Similarly, there were two occasions that a team was leading 4 goals at half time and they all won it eventually.
To summarise, going from a tie to a lead by 1 goal, 2 goals and then 3 goals or more, the chance of winning the game increased from 29% to 68% to 91% and then to 100% eventually. “Three-goal cushion” was a guarantee of the three points instead of two-goal.
In terms of analysis, this analysis could go further in depth by separating the home and away game results to see whether it is easier to hold the lead in home.
Share this:

Time Analysis of League 2 teams
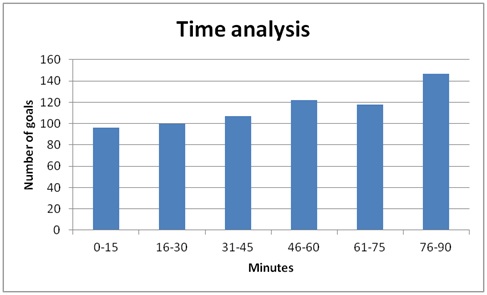
There are 690 league 2 goals (updated to 13/12/2012). There are many perspectives of analysis of goal scoring. This article will focus on the time at which goals are scored during match play. The analysis would be useful for coaches because the relationship between goal scoring and time would appear to be linked to physical conditioning and characteristics of different teams.
I divided the 90 minutes into six 15-min periods. The following chart shows that there is a systematic and significant upward trend in the number of goals scored as time progressed. This is a support to previous research suggesting an increase in the frequency of goals scored as a match progresses (Jinshan et al., 1993; Reilly, 1996).
Then we move on from the genearl perspective to the team perspective to analyse the goals. The following table shows the number of goals scored in six periods of different teams. The data were shown in a Red-Yellow-Green colour scale. That means, the higher number would be highlighted by red and the lower number would be highlighted by green for better visualisation of the data.

Generally, most of the teams scored more goals in the second half which fit the general trend. However, Aldershot is an exception as they scored the least goals in the last 30-min period among League 2. On the other hand, Fleetwood is expertised in scoring late goal in the last 15-min period. The 12 goals they scored is remarkably higher than the goals they scored in other periods. Northampton and Port Vale are strong in the last 30-min period as well.
However, if we just count the goals scored, it is not showing the whole picture of analysis because stronger teams scored more goals. If we want to find the characteristics of the teams, we have to convert these data into percentage. For example, in the first 15-min of the game, Bristol Rovers scored 7 goals, same as Oxford United but less than Gillingham. A different table will show you a different picture. The following table shows the same set of data in percentage form.

Bristol Rovers become the best team to score early goals which is obviously a characteristic of this team. Even Gillingham scored the most goals in this period, it is only 21% of their total number of goals. This percentage is less than Oxford United and Wycombe.
The result of Fleetwood becomes more obvious. It seems that they tried to save energy in the 46-75 minutes by scoring only 11% of goals and then dominate the final 15 minutes in scoring 43% of their total goals.
Wycombe shows the same trend in both halves that they scored most of their goals in the first 30 minutes. They are particularly weak in the last 15 minutes of the half. The possible explanation is the deterioration in physical condition of players is more serious in Wycombe. Accrington, Bradford and Southend have a similar characteristic because they all scored less than 20% of their goals in the first 30 minutes of the game. It would be a good strategy to start attacking early when other teams play against these three teams.
Reference
Jinshan et al., 1993. Analysis of the goals in the 14th World Cup. In: J. C. a. A. S. T. Reilly, ed. Science and Football II. London: E. and F.N. Spon, pp. 203-205.
Reilly, T., 1996. Motion analysis and physiological demands. In: T. Reilly, ed. Science and Soccer. London: E. and F.N.Spon, pp. 65-81.

