Blog Archives
League 2 2012/13 review: Top Scorer – Tom Pope

The top goal scorer in League 2 this season is Tom Pope, who is playing in Port Vale. He played every single game this season which means he had 46 league appearances. He scored 31 league goals. Port Vale had 87 league goals in total. Therefore, Pope has scored 35.6% of team goals. He is a tall striker with the height of 1.91m. He is 27 and will become 28 next season so he is at the peak of his career according to the analysis of optimum player age from Prozone.
How he scored?

In 31 goals, he scored 13 header goals, 9 goals by right foot and 9 goals by left foot. He is an all-round striker who can score goals through different ways. He is strongest at header goals (42%) and it is reasonable considering his height (1.91m). He is good at both feet as well because he scored considerable amount of goals through right and left foot.
Where he scored?

The above chart shows that Pope scored most of his goals in the 6-yard box (13 goals) and 6-12 yard area (13 goals). Considering 42% of his goals were header goals, it shows that he played like a target man inside the box and waited for the chances in the 12-yard area from the goal. Therefore, he is not good at long shot as he scored only 1 goal outside the penalty area.
When he scored?

The chart shows a characteristic of Pope. He was particularly strong at the 15-min period of both halves. He scored 8 goals in 16-30 mins and 61-75 mins periods. The phenomena was more obvious in the first half as he scored only 2 and 3 goals in the first 15 mins and last 15 mins in the first half.
Open play vs. Set play
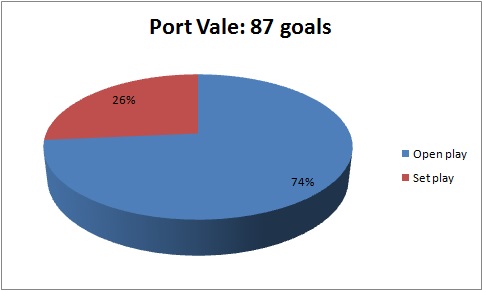
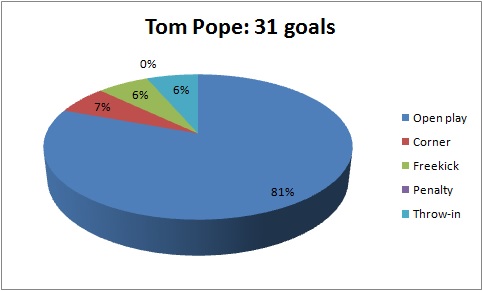
The above two charts show the comparison of the Tom Pope and the team regarding the open play and set play goals. In Port Vale team, 74% of goals were open play goals. On the other hand, 81% of Pope’s goals were open play goals. That means Pope contributed for the team more in open play goals. He hadn’t scored any penalty this season. He had only 6 goals from set play.
Where the assists came from?

The above diagrams show that most of the assists were from the flanks (67.7%), especially the left flank (48.4%). 32.3% of assists were came from the middle zones. It shows that the delivery from the flanks were more suitable for Pope to score. It fitted the previous result showing that he is strong at header. This leads to an assumption that crossing should be the main source of the assist type which will be discussed in the following chart. The reason of 48.4% of assists in the left flank could be explained by Port Vale’s strength to attack through the left flank.
Types of Assist

The previous results show that Tom Pope is stronger at header and most of the assists were came from the flanks. The above chart supports the previous findings because it shows that crossing is the main source of the assist styles (45%). The “others” assist style included dribbling and regaining possession but these were not the main source of Pope’s goal. The second main assist style was passing (26%). It was related to the following analysis about the number of touch he used to score goals.
Number of Touch

68% of Pope’s goals were scored by one touch. It fitted the previous results showing that 45% of his goals were from crossing and 26 out of 31 goals were scored within the 12-yard area from the goal. His ability to score one-touch goals is a key to his playing style as a target man working mainly near the goal. Remember he is an all-round striker who is good at scoring goals by header, right foot and left foot. It helped him a lot to score one-touch goals.
Conclusion
To conclude, here are some key statistics and findings of Tom Pope’s 31 league goals this season (2012/13):
- He is an all-round striker with 42% header goals, 29% right foot goals and 29% left foot goals
- 26 out of 31 goals were scored with 12-yard area from the goal. It fits his playing style as a target man.
- He was particularly strong at the 15-min period of both halves (i.e. 16-30 mins and 61-75 mins). 16 out of 31 goals were scored in those 30-min periods.
- He was stronger at open play (81%) than set play (19%) comparing with the stats of the Port Vale team (74% vs. 26%).
- 67.7% of the assists were from the flanks, especially left flank (48.4%)
- Crossing was the main source of the assist style (45%)
- 68% of his goals were scored by one-touch
In order to bring out the best in Tom Pope, Port Vale should provide crosses from the flanks and let Pope stay at the 12-yard area from the goal for him to score one-touch goals in the coming season.
Share this:

Analysis of top 4 strikers in League 2 (2)
The analysis is continued following the first part last week (here). In the shot analysis, when treating unequal frequencies of starting appearances, the data are “normalised” by dividing the data by the frequency of starting appearances.
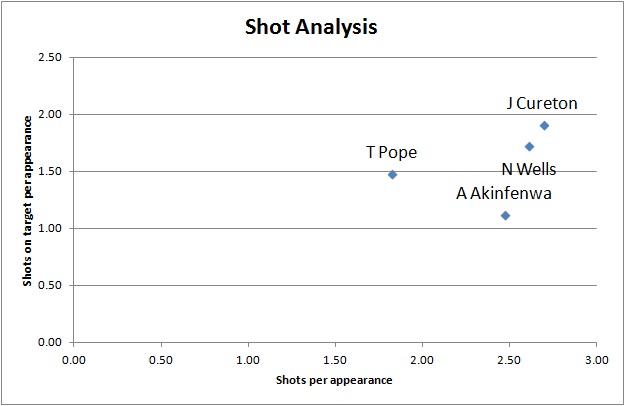
Although the other three strikers have at least 2.5 shots per appearance, T Pope had only 1.83 shots per appearance which is significantly lower than others. In terms of getting shot chances, T Pope is weaker than the other three strikers. On the other hand, A Akinfenwa showed his weakness as he only got 1.12 shots on target per appearance. N Wells and J Cureton are similar, both getting high number in shots and shots on target. Even T Pope got less chance to shoot; he still managed to get 1.48 shots on target which means he utilise the chances well. If you look at this chart only, you may wonder why T Pope is the leading goal scorer in League 2. It is all because he is particularly strong at catching the chances even the chances he get are less than others. This brings us to the next analysis chart: Accuracy rate vs Conversion rate.
Accuracy rate = no. of shots on target / no. of shots total
Conversion rate = no. of goals / no. of shots total
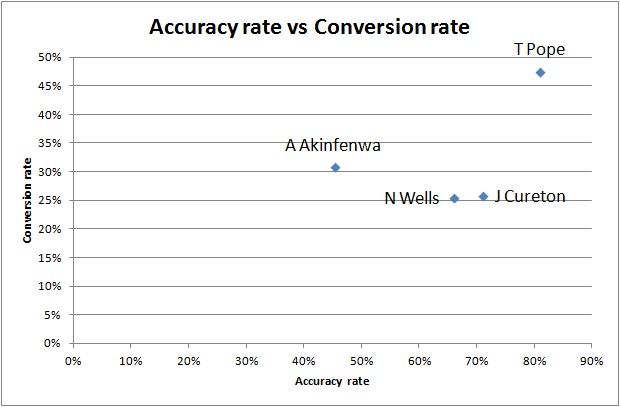
T Pope is outperforming others in this chart in both rates. In previous chart, N Wells and J Cureton showed they got more chances to shoot and they did well in number of shots on target. It is reflected in their decent accuracy rate (66% and 71%). However, conversion rate is their weakness (26%) and it explains why they can’t be the leading goal scorer even they got more chances. T Pope’s conversion rate (48%) is 22% more than them. A Akinfenwa did well in conversion rate (31%) but he is weak at accuracy rate (45%). From the above two charts, you may realise N Wells and J Cureton are so similar. They both good at getting shooting chance, have a decent accuracy rate but weak at converting chances into goals. T Pope is another type of striker who is highly efficient. A Akinfenwa strike a balance between both types.
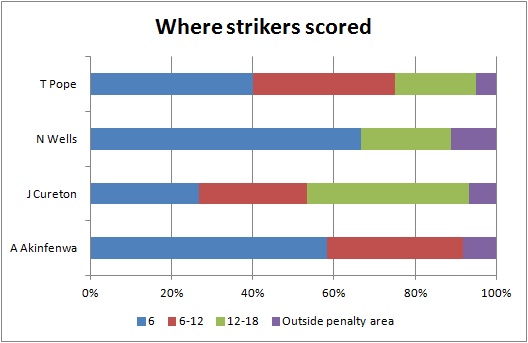
In analysing where the strikers scored, we can find out other characteristics of the strikers. A Akinfenwa is weak at long shot because only 8% of his goals were scored outside 12 yards from the goal line. It is reasonable if we combine the finding last week suggesting that he is strong at scoring by headers and in set play. N Wells is strong at scoring in 6-yard box (67%). Last week, we found out that he hasn’t scored any goal by header. If we combine both together, I guess that his goal scoring style is like “poacher” to catch the chances in 6-yard box by using his agility rather than strength. T Pope and J Cureton had a good balance in goal scoring area with T Pope stronger at 6-yard box and J Cureton stronger at 12-18 yard area.

This chart fits our finding beforehand. A Akinfenwa is strong at heading and he scored 92% of his goals within 12-yard area from goal. It is reasonable to see that he scored all goals by using 2 touches or less. N Wells fits his “poacher” style by scoring all his goals using 2 touches or less. In terms of using 3 touches or more, T Pope had the highest percentage (20%). If we combine our finding of his high conversion and accuracy rate, it can somehow show his composure in front of the goal by getting the best chance to score.
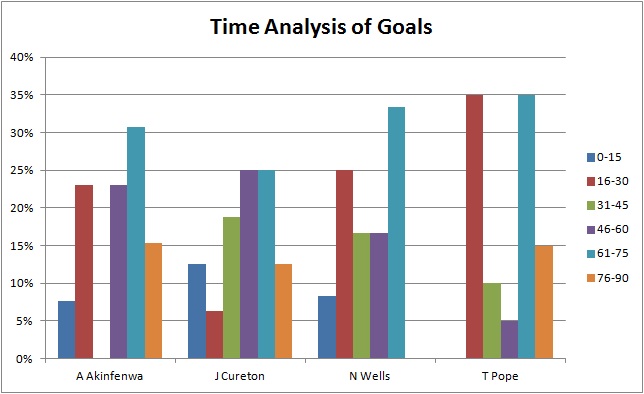
We can find out the strikers’ particular goal scoring pattern by using time analysis. Firstly, A Akinfenwa is much stronger in second half, only 31% of his goals were scored in the first half. Note that 46% of his goals were scored in the last 30 minutes of the game. This may be explained by his strength and strong header to attack at the end of the game. N Wells haven’t scored any goal in the last 15 minutes of the game. It is reasonable if we sum up the previous findings. Usually there will be direct style and long ball in the last 10-15 minutes if a team is losing, but N Wells is not the same type of striker like A Akinfenwa. N Wells is strong at feet and agility rather than header and strength. T Pope’s goal scoring pattern is interesting. 70% of his goals were scored in the mid 15 minutes of the halves. Only 5% of goals were scored in the first 15 minutes of the halves. He may need time to “warm up” in the game before showing his goal scoring power. Then we move on to the assist analysis to see how the strikers’ goals were assisted.

J Cureton is stronger than others in dribbling which can create the scoring chance himself. A Akinfenwa and N Wells have no dribbling goals, that means they heavily rely on the support from teammates because they can’t create chances themselves. It is reasonable if we refer back to the characteristics of these two strikers. N Wells is strong at scoring in rebounds because 25% of his goals were assisted by teammates’ shots. It fits his “poacher” style mentioned above. Moreover, none of his goals were come from crossing. Surprisingly, only 20% of T Pope’s goals were assisted by passing. He relied on crossing (40%) more than other strikers. Then we analysed where the assists were. Please note that only open play goals assists were shown in the following diagrams.
A Akinfenwa:
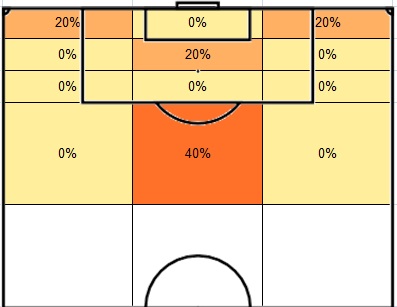
As I mentioned last week, A Akinfenwa is strong at headers and set play. This diagram shows that his headers goals were heavily linked to set play. Therefore, only 40% of open play goals assists were from the flanks.
J Cureton:

J Cureton’s goals were mainly assisted from the right flank and centre. If any team play against Exeter, they should pay more attention to defending at their left flank (particularly from 12 yard to outside the penalty area) because 35.7% of J Cureton’s goals were assisted from these two zones.
N Wells:
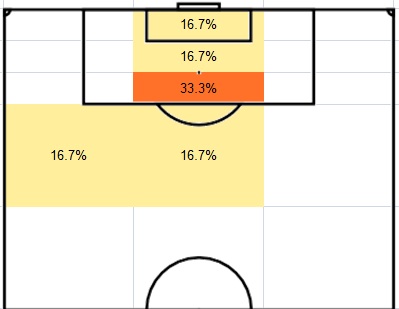
This diagram further supports my previous arguments about the characteristics of N Wells. He is strong at agility and feet, weak at headers and strength. He plays like a “poacher” but none of his goals were come from crossing. Therefore, this diagram is under expectation that 83.3% of assists came from centre. By using this diagram, we know more about how he scored. 33.3% of assisted were from 12-18 yard area. If we combine this with the previous findings:
- 67% of his goals were scored in 6-yard box
- 50% of assists were passing, 25% of assists were shots
- 89% of goals were scored by feet
- 100% of goals were scored by 2 touches or less
We can figure out a full picture how he scored open play goals: his teammates attack through middle of the pitch, making a pass or take a shot (particularly 12-18 yard area). If it is a pass, he would at most take one touch before the shot. If it is a shot, he would take the rebounding chance in the 6-yard box.
T Pope:

From last week’s finding, T Pope is an all-round striker. He is good at scoring by right foot, left foot and header as well. Even in this assist diagram, the assists covered a wide range of areas. These make defending the leading goal scorer a difficult task. However, it is still a useful tip to find out that 41.3% of assists came from centre.
I think the whole analysis process covers enough details to find out the characteristics of the strikers. This is the end of the striker analysis. I may make a review about striker analysis at the end of the season.
Share this:

Analysis of top 4 strikers in League 2 (1)
Different strikers have their own characteristics in scoring goals. They can somehow reflect their teams’ goal scoring characteristics as well. We will focus on the top 4 goal scorers in League 2. The analysis is quite long so I divide it into two posts. The second part will be continued next week. The following table shows who they are, their team and the position in league table. Please note that all the data is updated to 28/12/2012.
|
Name |
No. of goals |
Team |
Team league position |
|
T Pope |
20 |
Port Vale |
2nd |
|
J Cureton |
16 |
Exeter |
10th |
|
A Akinfenwa |
13 |
Northampton |
11th |
|
N Wells |
12 |
Bradford |
5th |
It seems that being a top team does not necessarily need a top goal scorer as only 2 of the top 4 strikers are playing for a team in the top 7 of the table which is the promotion playoff line. The other 2 strikers are playing for the teams in the mid-table position. However, I agree that a high quality striker can bring an average team into a top team.

Although T Pope is the top goal scorer, he doesn’t have the highest percentage of team goals. J Cureton is the striker whom the team relies on the most because he scored 47% of the team goals. It is worthy to note that all 4 strikers scored more than one-third of the team goals.
Apart from looking at the number of goals, we should analyse by looking at the starting appearance as well in order to understand the efficiency of the strikers.

As the top league goal scorer, T Pope is the most efficient striker as well. He scored 0.87 goals per starting appearance. Note that J Cureton scored more goals than A Akinfenwa but A Akinfenwa is more efficient because he scored slight more goals than J Cureton in terms of goals per starting appearance.
We discussed how important the first goal before (here) so it is worthy to analyse the strikers’ ability to scored the first goal in the match.

A Akinfenwa performed much better than other strikers in terms of first goal. 46% of his goals were first goal, which is obviously higher than that of T Pope (30%) and J Cureton (31%). His percentage of first goal is almost double the percentage of N Wells (25%). This is A Akinfenwa’s strength and people may ignore it if we don’t analyse the strikers from this perspective.
Then we move on to analyse the relationship between open play and set play goals.
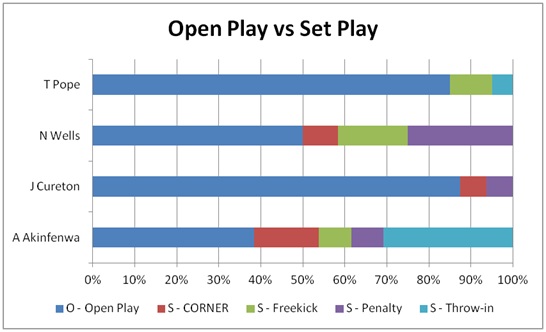
T Pope (85%) and J Cureton (88%) scored most of their goals in open play, obviously higher than the percentage of other two strikers. N Wells struck a balance by scoring 50% open play goals. However, 25% of his goals were come from penalties. A Akinfenwa is particularly strong at scoring set play goals as 62% of his goals were from set play. Note than 31% of his goals were from throw-in which is much higher than other strikers. Moreover, he scored the highest percentage of goals in corner (15%) as well. He is a good example showing that the team top goal scorer can reflect the goal scoring characteristic of the team. Northampton scored more goals in set play (53%) than open play (47%). In all 18 set play goals, 50% of them were came from throw-in. The goal scoring pattern of Northampton and A Akinfenwa is almost the same even he scored only 35% of team goals.
Then we will analyse how the strikers scored the goals.
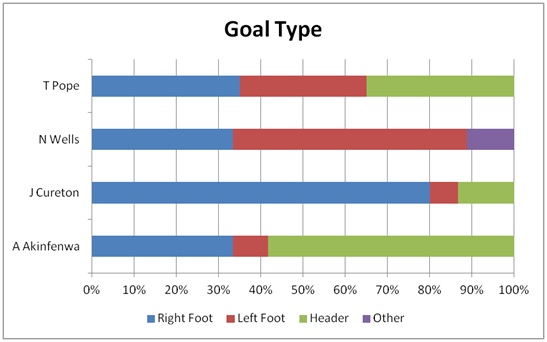
Note that I have excluded the goals from penalty in this chart. T Pope shows he is an all-round striker and this may explain why he is leading goal scoring table. The goals he scored by using his right foot (35%), left foot (30%) and head (35%) were almost evenly distributed. J Cureton is particularly strong at scoring goals by right foot (80%). However, it can be treated as a weakness as well because it is easier for the defender to mark him. N Wells is weak at header as he hasn’t scored any goal by header. However, he is strong at scoring goals by using both feet. A Akinfenwa is strong in air as he scored 58% of his goals by head. It fits what we find that he scored the highest percentage of goals from set play (62%) among 4 strikers, particularly in throw-in (31%) and corner (15%). In short, scoring goals by header in set play is the strongest weapon of A Akinfenwa.
The analysis will be continued next week by analysing these 4 strikers from different perspectives including where they scored, when they scored, where assist came from, assist types, shots total and shots on target.

