Blog Archives
Clean Sheets Analysis of League 2
A football game is all about attacking and defending. Therefore, keeping a clean sheet is as important as scoring goals. A team scoring a goal doesn’t guarantee any point but keeping a clean sheet guarantee at least one point and potentially getting three points. In this post, the defensive performance of League 2 teams would be discussed by analysing the clean sheets of League 2. Updated to January 28, there were 338 matches had been played, that means there were 676 team performances. Of these 676 team performances, 189 ended up with a clean sheet (28%). The teams produced 7.88 clean sheets on average. In these 7.88 clean sheets, 5.38 clean sheets led to wins and 2.50 clean sheets led to draws. On the other hand, clean sheets produced about 2.35 points per team and match on average.
The frequency of clean sheets is shown in the following chart.
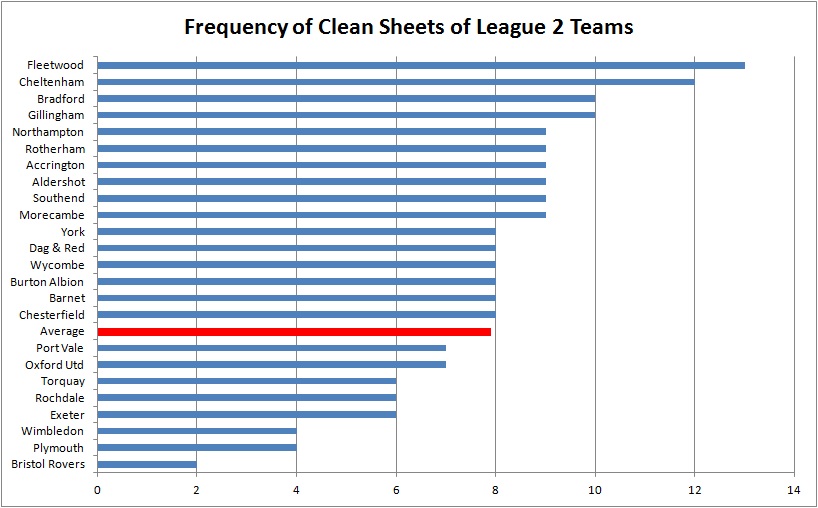
As shown in the chart, there is a huge range in abilities to keep clean sheets (from 2 to 13). Fleetwood and Cheltenham performed much better than other team, producing 13 and 12 clean sheets. Part of their ability to generate points has been their ability to produce good defence. In the top 4 clean sheet producers (10 teams), only Accrington, Morecambe and Aldershot are in the bottom half of the table. It indicates two results. Firstly, good at keeping clean sheets can lead to good league positions. Secondly, it suggests that defence is not the main issue of the above 3 teams. In order to improve their league positions, they should focus on improving their attacking. Moreover, the bottom 2 clean sheet producers are Bristol Rover, Plymouth and Wimbledon. They are the bottom 3 teams in the League 2 table as well which indicates the importance of keeping clean sheet. On the other hand, it shows how strong Port Vale’s goal scoring was. Port Vale only produced 7 clean sheets which are below average. However, they are at the top of the table which means the high number of goal scored can overcome the weakness of their defence.
Clean sheets were of different value for different teams. This is shown in the following chart.

Clean sheets had enormous value (3 points) for Exeter and Wimbledon. For every single match they held clean sheet, they won the game and got 3 points. Note that Wimbledon is at the bottom of the league table. That means the biggest problem of Wimbledon right now is the defence, not attack. On the other hand, Plymouth had the worst performance in the above chart. It shows that even Plymouth had kept clean sheet, they only managed to 1.5 points on average. Considering both charts, it means that Plymouth is having problems in both attack and defence. In the top 5 teams in this chart, 4 of them are in the top 6 of the league table. In other words, it’s not only keeping clean sheets that’s important, but also how the team managed to get points from clean sheets.
By combining both charts together, the teams can be analysed from another perspective which is shown in the following diagram.

In this chart, the two axes are the two average numbers (2.35 points gained and 7.88 frequencies of clean sheets). The objective of using two average numbers as the axes is to divide 24 teams into four quadrants showing different abilities. Firstly, Bristol Rovers, Plymouth, Torquay and Rochdale are at the bottom left corner. The characteristic of the teams in this quadrant is that they are both weak at producing clean sheets and getting points from clean sheets. The opposite quadrant is the top right quadrant which means the teams were good at producing clean sheets and got points from clean sheets as well. Gillingham was the best performer in this quadrant which means Gillingham had a good balance of attack and defence. On the other hand, the top two performers of keeping clean sheets were in the bottom right quadrant, they should focus on improving their attacking because it was the main issue hindering both teams from getting points from clean sheets. The same argument could be applied to Aldershot and Morecambe as well since they are at the bottom half of the league table. Port Vale didn’t show why they can be the top of league table in this chart because they were weak in producing clean sheets. However, their efficiency is better than Gillingham by getting more points per clean sheet game.
To conclude, keeping clean sheets is a strong indicator of a team’s defending ability. However, it’s not only keeping clean sheets that’s important, but also how the team managed to get points from clean sheets. Therefore, by dividing 24 teams into four quadrants showing different characteristics, we can understand why some teams are doing better than others and which aspects (attacking or defending) should be the main focus point for team improvement.
Share this:

England League 2: How important is the first goal?
Performance analysis is usually thought as an elite tool which is for big clubs and high level leagues only because big clubs have the resources to afford analysis software and different IT technological support. In my opinion, it should not be the case. Performance analysis is a process which can be done by small football clubs also. Small clubs don’t have the big budget to do as much as the big clubs do but we are going through the same process. That’s why I would like to share my experience and work of doing performance analysis in a League 2 club.
No doubt, everybody knows the first goal is important. However, do they know how important it is? How to transfer the concept of “importance” to a quantified stuff, such as points? Different leagues have different levels; we can’t apply all the findings in Premier League to League 2 as there are so many differences such as playing styles, distance covered, etc. I would quantify the concept of “importance” by making statistics about the points got at the end of the game by a team when they scored or conceded the first goal. I would call it as “expected points” which means the points a team expected to get from the first goal. I would use different perspectives to analyse the first goal in league 2:
- Time of goal
- Match location (Home or Away)
- League position (In groups)
- Team
Average
I used the first 8 league games in each team, which means 95 games in total (the game between Wycombe and Bristol Rovers on 25/8 was excluded as it was abandoned 66 minutes). Among these 95 games, 86 games had goal(s). The following chart shows that the expected points of scoring first and conceding first are 2.30 and 0.49 in average. These would be used as a reference for other results found by using different perspectives.

Time of Goal
Time is an important factor of first goal. I divide 90 minutes into 6 categories, which mean 15 minutes per category.

Teams got most expected points (3 points) when they scored the first goal in 76-90 minutes. It is reasonable as there is not much time for the opponent to fight back. However, there were only 2 goals scored in this timeslot which makes this finding not so persuasive since the sample size is not big enough. I’d rather to ignore this timeslot. Teams could get high expected points if they score the first goal between 16 to 45 minutes, 30 minutes timeslot before the interval. Since the expected points drops after 45 minutes, the first goal scored within 30 minutes before half time are more valuable than first goal scored 30 minutes after half time. I heard argument that scoring before the interval is a great advantage but statistics in this chart showing that the expected points from 16-30 minutes and 31-45 minutes are similar. However, a similar argument may be right. Scoring before the interval is particularly damaging to the opposition. As you can see from the chart, teams conceding first goal just before half time could only get 0.29 expected points which is obviously less than conceding first goal in other timeslots which fits the argument. Nobody would like to concede an early goal but statistics show that the team don’t have to be pessimistic even they do concede an early goal within 1-15 minutes. Teams can get 0.64 expected points which is the highest comparing with other timeslots. This can be explained that the team still have much time to bounce back.
Location

From the above chart, teams scoring the first goal in home were more likely to keep the winning positions and get more points than scoring first in away game. It may be explained by home advantage that teams play better in home. However, the same argument can’t be applied in conceding first because they both got 0.49 expected points. Home advantage may help the team more to keep winning position but not bouncing back from behind.
League Position

Note that the league positions are updated to 1/10. In scoring first (blue columns), an obvious downward trend can be seen which shows that stronger teams were more likely to retain their winning position when scoring first. There is a big gap difference (0.51 expected points) between positions 1-6 and positions 7-12. Another big gap difference (0.49 expected points) appears in between positions 7-12 and positions 13-18. However, there is not much difference (0.11 expected points) between positions 13-18 and positions 19-24. I would say in terms of the ability to retain winning position after scoring first, there are 3 levels in league 2. Positions 13-24 would be at more or less the same level. Positions 7-12 are much better than the bottom half of the table but positions 1-6 are much better than positions 7-12 as well.
The downward trend can’t be seen in considering the conceding first (red columns). Positions 13-18 got a better result than positions 7-12, similar to positions 1-6. In fact, it surprises me a little bit as I expected the downward trend in conceding first same as scoring first. We would look at individual teams afterwards to see what we can find. However, the expected points from positions 19-24 (0.16 points) are obviously less than other groups. It shows that they struggle to bounce back if they concede the first goal.
Team

The tables are listed according to the league position (updated to 1/10). The above table is about scoring first. The first 8 teams in the league table all scored first goals for at least 4 times. Among these 8 teams, 4 of them get expected points of 3 which means that whey they scored first, they kept the winning position and won the game every time. Gillingham scored first goal in 7 out of 8 games which is a brilliant result. Moreover, they retained and won all those 7 games which make them the best in league 2. Rochdale performed very well since they scored first goal 6 times, which is the second best. However, their weakness is to retain the winning position because they can only get 1.8 expected points, which is the worst in the top half of the table. Plymouth scored first goal twice but they get only 0.5 expected points per game which means they couldn’t won a game even they scored first. This result is the worst in the league. We would look at the conceding first in the following table.

Although Plymouth is the worst team in retaining winning position, they are the strongest team in the league 2 to bounce back from conceding first. They conceded first goal four times, but they bounced back and won the game twice so they got 1.5 expected points per game, which is 50% better than a draw. This is the best result in the league 2. Exeter and Torquay are the second best teams, getting 1.3 expected points. It is worthy to note that Torquay and Plymouth are at the 15th and 16th of the table, but they are the two best team to bounce back from conceding first. This can explain why in the league position chart positions 13-18 performs surprisingly better than expected.
Conclusion:
- Scoring in 16-30, 31-45 minutes (30 minutes before half time) can get higher expected points
- Conceding 15 minutes before half time would be the worst time to concede the first goal
- Playing in home is more likely to retain the winning position
- In terms of bouncing back, there is no difference in playing home and away games
- The 12 teams in the top half of league table are much better in retaining winning position than the bottom half of the table. Among those 12 teams in the top half of table, the first 6 teams are significantly better than positions 7-12 teams.
- Positions 19-24 teams are obviously weak in bouncing back when conceding first
- Gillingham is the strongest team to score first and retain the winning position
- Rochdale is strong in scoring first but weak at retaining the winning position to the end of the game
- Plymouth is a special team. They are the worst team in scoring first and get only 0.5 expected points. However, they are the strongest team in bouncing back from conceding first, getting 1.5 expected points.
This is my first analysis article about league 2. I will write at least a few more articles about league 2 this season.

