Blog Archives
Northampton – Stoke City in League 2? (Part 2)
In part 1, I have compared Northampton’s performance with other teams in League 2. It was clear that Northampton was strong in set play, particularly throw-in. Over 50% of their goals were from set play. In their set play goals, around 40% of them came from throw-ins. I will focus on analysing those 13 throw-in goals in this piece.
Time Analysis

No matter we consider the throw-in goals or all goals of Northampton; they both fit the general trend of time analysis in League 2 because more goals were scored in the later stage of the game. However, the key point is about the time slot of 76-90 minutes. 29.7% of goals were scored in this time slot in all goals. On the other hand, 38.5% of throw-in goals were scored in this time slot considering that the percentages in other time slots were only 15% at most. It shows that throw-in was an effective strategy for Northampton to use in the last 15 minutes of the game to score goals.
What were the assist styles?
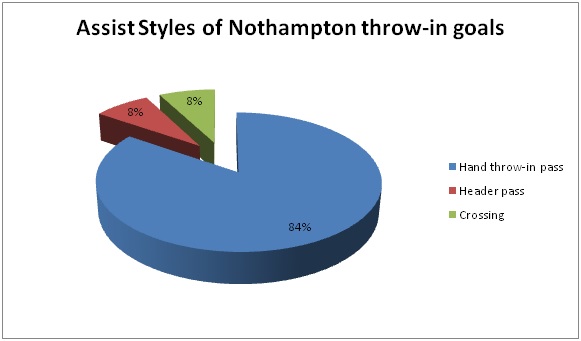
Considering the assist styles, some teams may choose to do flick-on headers to make assist. In Northampton’s case, the best way to make assist is to make a direct throw-in passing by hands. 84% of the throw-in goals were assisted by hand passes, only 8% of them were assisted by flick-on header. It also means that at least 84% of the goals were scored by one-touch shot. The technical ability to make one-touch shot is one of the keys to score throw-in goals.
Goal Type

Many people may link throw-in goals to headers but it is not the case in Northampton. Even we found out that one-touch shot is important, the above chart shows that using feet to shoot is as important as header in scoring throw-in goals. Header goals were only 8% more than feet goals. If we consider the above two charts together, we realise that considerable amount of goals were scored by hand passing throw-in followed by shots made by feet. It may be a result not expected by some people.
Where were the assists made?
Since 84% of assists were from direct hand throws, only 7.7% of assists were from central area by flick-on header. It is worthy to note that 30.8% of assists were outside 18-yard from the goal line. Some teams may only use long throw tactics near penalty area but Northampton’s statistics show that it is worthy to do long throw outside the penalty area also.
Who scored the most throw-in goals?

Northampton did not rely on any particular player to score throw-in goals as the goals were widely distributed to 8 players. A Akinfenwa is the player who scored the most with 31% of throw-in goals considering he is a striker. The other 7 players scored 1 goal each. It is worthy to note that 15% (2 goals) were scored by own goals. It shows that one of the advantages in using long throw-in is to mess up the situation in penalty area so the defenders would have a higher chance to make a mistake scoring own goal.
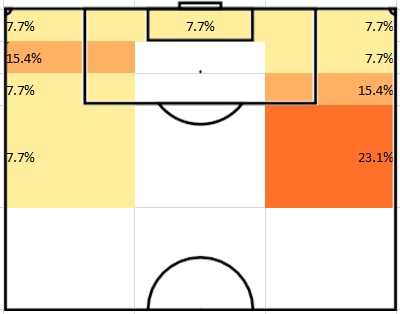
Where they scored?

The above diagram obviously shows that the prime area for attacking long throws is the 12-yard area from the goal line. 84.6% of goals were scored in these two zones. Note that 15.4% of goals were scored outside the penalty area. My explanation is that most of the defenders would try to defend long throw-in by staying at the zones in front of the goal. It leaves space outside the penalty area for attackers to make long shot. It is worthy to note that no goal was scored in 12-18 yard area. It is because this zone is neither close enough for one-touch shot in long throws nor having enough space and time for players to make long shot.
Conclusion
By analysing Northampton’s strategy in throw-ins, we can identify why they are so strong in scoring throw-in goals. Firstly, they used a very direct style to attack. They didn’t prefer flick-on header as 84% of assists were came from direct hand throw-in passes. Secondly, one-touch shot is the key to score but we should be aware that using feet to score is almost as important as using header. Thirdly, Northampton did not rely on any particular player to be the target man to score throw-in goals. They had 8 players to score 11 throw-in goals (the other 2 goals were own goals). Fourthly, don’t ignore the importance of making delivery outside the penalty area (18-yard line) because 30% of their throw-in goals were delivered from zones outside the 18-yard line.
Share this:

Header Goals Analysis in League 2 – Part 2
Continuing the header goals analysis from part 1, the set play header goals would be focused in this post. Note that all the goals data were updated to 3/1/2013 (same as part 1). The goal scoring patterns of header goals were different between open play and set play. The following diagram shows where the header goals were scored in set play.

Figure 1: Where set play header goals were scored
If we compare this diagram with the open play version in part 1, two main differences would be found. Firstly, the prime header goals scoring area of set play was the 6-yard box. This finding was different to the open play, where 6-12 yard was the prime header goals scoring area of open play. Secondly, in set play all the header goals were scored within 12 yards from the goal line. In open play, there were still 3.3% header goals scored outside the penalty spot. It shows that scoring header goals in open play and set play needs two different tactics. In open play, the difference of percentage of goals between 6-yard box and 6-12 yard was not too big, only 5.4% difference. However, in set play the difference became 31.4%. In other words, in set play the player should focus on delivering the ball into the 6-yard box. Otherwise, the chance of scoring header goals would be greatly reduced but it was not the case in open play.
Corner Header Goals
Many people may closely link corner goals to header goals because they assume header goals should be the dominating goal types of corner goals. However, statistics shows that it was the case in League 2.

This chart shows that header goals were the main source of corner goals but it was not a dominating factor. If the coach only focuses on scoring by header in corner set play training, he is ignoring the importance of scoring by feet. It was because 52 corner goals were scored by feet. For example, scoring by rebound or picking up the second ball. In this post, we will focus on how those 59 header corner goals were scored.
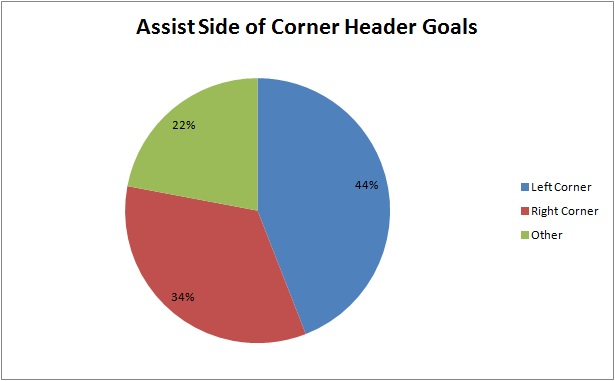
This chart shows that more corner goals were come from left side (44%) than right side (34%). The reason behind it was closely related to the types of delivery which would be discussed. This chart also shows that 78% (44%+34%) of corner header goals were directly assisted from corner delivery. The remaining 22% were come from short corner, header flick on or scoring in second phase of attack in corners. This finding shows the importance of getting the first touch in scoring corner header goals. The most effective way to score was the direct delivery.
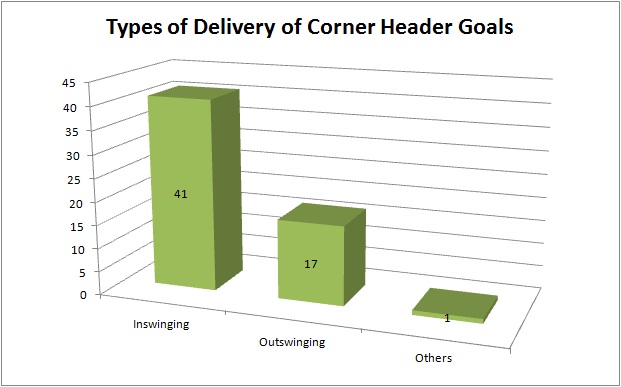
In terms of delivery, inswinging cross was the best way of delivery. 41 corner header goals were scored by inswinging cross but only 17 corner header goals were scored by outswinging cross. Moreover, it was not a good idea to use any other delivery method (e.g. short pass or pass to the edge of the box) because only 1 goal was scored by other methods. Since most of the corner header goals were delivered by inswinging cross, it explained that more corner header goals were come from left side considering most players are right-footed.
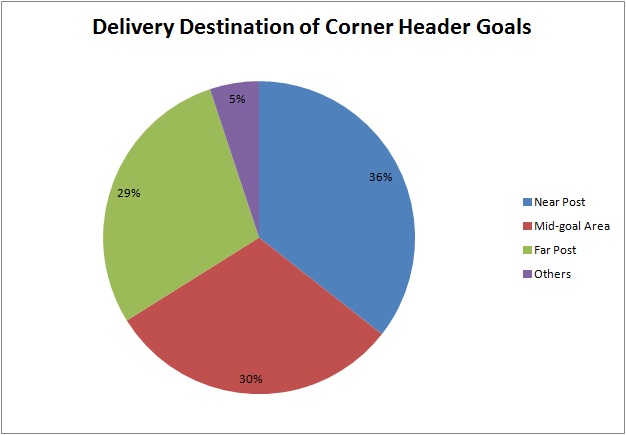
The area in front of the goal was divided into three different aim zones: near post, mid-goal area and far post. This chart shows that near post was the best place to be delivered to score corner header goals because 36% of goals were scored in near post. On the other hand, the percentages of mid-goal area and far post were similar (29% and 30%). The above two findings show that the inswinging corners delivered to the near post was the most effective way. It fits the argument of Hughes (1990) arguing that the theme that pays the highest dividend in corners is an inswinging corner to the near post in the book “The Winning Formula”.
Moreover, more than 90% of corner header goals were scored in the first phase. In other words, if the ball is cleared by defenders, the chance of scoring header goals would be greatly reduced even the ball is delivered into the penalty box again. By summing up the findings about corner goals, the best way of scoring corner header goals was to deliver inswinging corner from the left side to the near post and scored it in the first phase (first touch).
Free Kick Header Goals
Comparing with the corner goals, the header goals in free kick is less important which was shown in the following chart.

The most common goal type of free kick was to score by right foot. There were 32 header goals scored in free kick which was less than goals scored by right foot by 4.
The best delivery zone of free kick header goals was found by considering where the assists came from.

Figure 2: Where free kick header goals were assisted
Firstly, the zones just outside the penalty box were the better areas for delivery because 62.5% of free kick header goals were delivered from these three zones. Secondly, right flank was better than left flank because 50% of free kick header goals were delivered from right flank. By combining both findings, it can be concluded that the best delivery zones for free kick header goals were the zones outside the penalty box in two flanks, especially the right flank (21.9% in left and 37.5% in right).

In terms of types of delivery, inswinging delivery was still the best way, which is the same finding from corner header goals. However, it should be noted that the difference between inswinging (18 goals) and outswinging (11 goals) was much smaller in free kick than in corner. In other words, higher percentage of header goals was scored by outswinging delivery in free kick than in corner.

Mid-goal area was the dominating factor in the delivery destination of free kick header goals. This finding was different from that in corner. In corner, near post was the best area to be delivered but mid-goal area was the best area in free kick. Moreover, the difference was greater in this chart as there was 29% difference between mid-goal area (59%) and far post (30%), while the difference was only 6% in corner. That mean the advantage of delivering to mid-goal area in free kick was more obvious than delivering to near post in corner.
By summing up the findings about free kick, the best way of scoring free kick header goals was making an inswinging delivery to the mid-goal area from the zone outside the penalty area in right flank.
Conclusion
Scoring header goals in set play need a different tactic than in open play as the prime goal scoring area was different. Even in the set play goals, header goals had different importance to different set plays. Header goals were the most important in corner but less important in free kick. Moreover, the most effective way of scoring header goals in corner and free kick were different. Therefore, coaches should separate the training of corner and free kick since the tactical needs were different.
Reference
HUGHES, C., 1990. The Winning Formula. London: Collins
Share this:

Header Goals Analysis of League 2 – Part 1
How important are the header goals in League 2? Most of the goals are scored by right foot, left foot or head but they are not evenly distributed. Updated to 3/1/2013, there were 948 goals in League 2. 44% of them were scored by right foot, 25% by left foot, 21% by header and 10% of goals were scored by other parts of the body or by penalty. In short, around 1 out of 5 goals were scored by header. It fits the argument of Hughes (1990) saying that about 1 goal in every 5 overall was scored with a header in the book “The Winning Formula”.

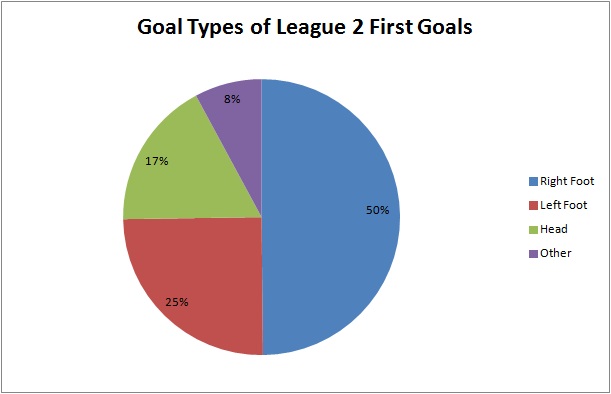
On the other hand, I explained the importance of first goal before so let’s look at the impact of header goal in League 2 first goals. There were 317 first goals and 17% of them were scored by header. That means it was less likely to score first goal by header while the impact of right foot was increased to 50%. It shows that attacking in header may not be a good choice to score first goal in League 2.
If we focus on the 200 header goals which is shown in the following chart, 54% of header goals were came from set play while 46% of them came from open play.

The above chart shows that header goals were scored more in set play (54%) than in open play (46%). Corner is the main source of header goals in set play, having 29% of total header goals. The importance of header goals is more obvious if the data is normalised by considering the total number of open play and set play goals.

There were 619 open play goals in League 2. The number of open play goals was more than that of set play goals. Even 46% of header goals were from open play, it only took 15% of total open play goals. It shows that the impact of header goals was not obvious because 84% of open play goals were scored by feet, particularly more than half (55%) were scored by right foot. It shows that if a team want to score open play goals, they should focus working more on their feet rather than header.
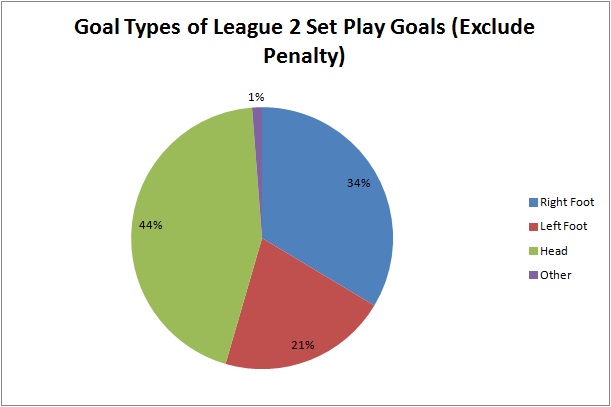
On the other hand, there were 244 set play goals (exclude penalty) in League 2. 54% of header goals were came from set play and it took 44% of set play goals. It highlights the importance of header goals in set play comparing with the situation in open play goals shown in previous chart. It gives a clue for the teams which are stronger at header. They should focus more on attacking in set play because it will give 29% more chance to score by header. However, it is worthy to note that even header goals were more important in set plays; it still took less than half of set play goals. In other words, more than half of the set play goals were scored by feet. It is very important for the practice of set play in training as they may only focus on attacking by headers. However, statistics show that the goals scored by feet in set plays were more than that by headers.
In this post, only open play header goals would be analysed. The analysis of set play header goals would be discussed next week because there are 3 types of set play (corner, free kick and throw-in) to be analysed.
Open Play Header Goals
Crossing was the main source of open play header goals because 85% of them were assisted by cross.

The remaining 15% were assisted by passing or shots. It indicated that there is a close relationship between crossing and header goals.
Some people may argue that the prime goal scoring area of header goal in open play is the 6-yard box because it is closer to the goal. However, it is not the case in League 2.
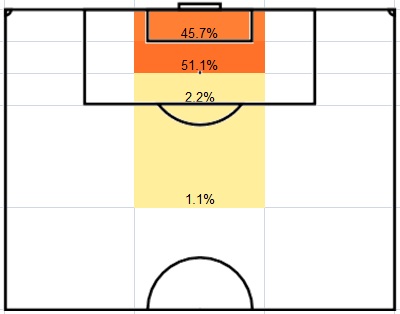
Figure 1: Where open play header goals were scored
The above diagram shows that more than half (51.1%) of the open play header goals were scored in the 6-12 yard area while 45.7% of them were scored in 6-yard box. It is similar to the argument of Hughes (1990). He argued that the “prime target area” extends out 8 yards, from 2 yards inside the 6-yard box to the penalty spot, and across 20 yards, the width of the 6-yard box. In this analysis, it shows that the prime scoring area of header goals is the 12-yard area from the goal to the penalty spot. For any header shots made behind the penalty spot, the probability of scoring decreased dramatically because only 3.3% of open play header goals were scored behind the penalty spot.
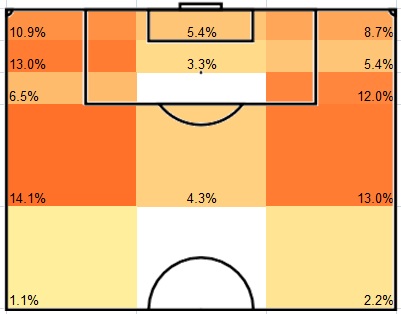
Figure 2: where open play header goals were assisted
From previous finding, crossing was the main source of assist to open play header goals. Therefore, it is not surprised to see that most of the assists were come from both flanks. Horizontally, there is not much difference between the right and left side which took 41.3% and 45.7% of assists. On the other hand, there were differences by analysing vertically. The assists made from the 18-yard area from the goal (65.2%) were much more than that from the zones outside the penalty area (31.5%). It is worthy to note that if the ball is delivered outside the final third of the pitch, it is much less likely to score by header because only 3.3% of assists were came from outside the final third of the pitch. If the delivery is come from the right side, the best delivery would be crossing from wide or deep because they took 12% and 13% of assist. The pattern would be different in the left side. Crossing near the goal line was better.
Conclusion
By combining the 3 points mentioned above, the best formula to score open play header goals in League 2 was found. It should be assisted by crossing. The ball should be delivered into the 12-yard area from the goal. The delivery area should be the final 18-yard area from the goal at both flanks. On the other hand, header goals were more important in set play than in open play. However, the importance of header goals should not be over-emphasised because over half of the set play goals were scored by feet.
The set play header goals would be analysed next week.
Reference
HUGHES, C., 1990. The Winning Formula. London: Collins

