Blog Archives
Clean Sheets Analysis of League 2
A football game is all about attacking and defending. Therefore, keeping a clean sheet is as important as scoring goals. A team scoring a goal doesn’t guarantee any point but keeping a clean sheet guarantee at least one point and potentially getting three points. In this post, the defensive performance of League 2 teams would be discussed by analysing the clean sheets of League 2. Updated to January 28, there were 338 matches had been played, that means there were 676 team performances. Of these 676 team performances, 189 ended up with a clean sheet (28%). The teams produced 7.88 clean sheets on average. In these 7.88 clean sheets, 5.38 clean sheets led to wins and 2.50 clean sheets led to draws. On the other hand, clean sheets produced about 2.35 points per team and match on average.
The frequency of clean sheets is shown in the following chart.
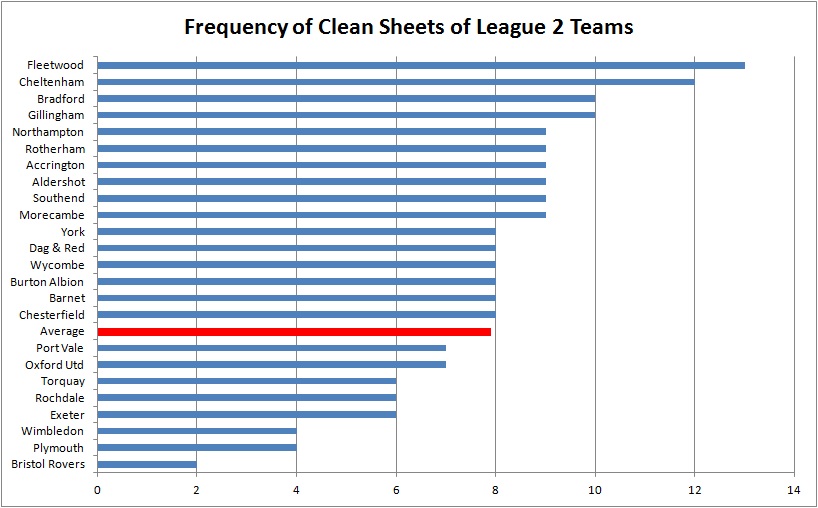
As shown in the chart, there is a huge range in abilities to keep clean sheets (from 2 to 13). Fleetwood and Cheltenham performed much better than other team, producing 13 and 12 clean sheets. Part of their ability to generate points has been their ability to produce good defence. In the top 4 clean sheet producers (10 teams), only Accrington, Morecambe and Aldershot are in the bottom half of the table. It indicates two results. Firstly, good at keeping clean sheets can lead to good league positions. Secondly, it suggests that defence is not the main issue of the above 3 teams. In order to improve their league positions, they should focus on improving their attacking. Moreover, the bottom 2 clean sheet producers are Bristol Rover, Plymouth and Wimbledon. They are the bottom 3 teams in the League 2 table as well which indicates the importance of keeping clean sheet. On the other hand, it shows how strong Port Vale’s goal scoring was. Port Vale only produced 7 clean sheets which are below average. However, they are at the top of the table which means the high number of goal scored can overcome the weakness of their defence.
Clean sheets were of different value for different teams. This is shown in the following chart.

Clean sheets had enormous value (3 points) for Exeter and Wimbledon. For every single match they held clean sheet, they won the game and got 3 points. Note that Wimbledon is at the bottom of the league table. That means the biggest problem of Wimbledon right now is the defence, not attack. On the other hand, Plymouth had the worst performance in the above chart. It shows that even Plymouth had kept clean sheet, they only managed to 1.5 points on average. Considering both charts, it means that Plymouth is having problems in both attack and defence. In the top 5 teams in this chart, 4 of them are in the top 6 of the league table. In other words, it’s not only keeping clean sheets that’s important, but also how the team managed to get points from clean sheets.
By combining both charts together, the teams can be analysed from another perspective which is shown in the following diagram.

In this chart, the two axes are the two average numbers (2.35 points gained and 7.88 frequencies of clean sheets). The objective of using two average numbers as the axes is to divide 24 teams into four quadrants showing different abilities. Firstly, Bristol Rovers, Plymouth, Torquay and Rochdale are at the bottom left corner. The characteristic of the teams in this quadrant is that they are both weak at producing clean sheets and getting points from clean sheets. The opposite quadrant is the top right quadrant which means the teams were good at producing clean sheets and got points from clean sheets as well. Gillingham was the best performer in this quadrant which means Gillingham had a good balance of attack and defence. On the other hand, the top two performers of keeping clean sheets were in the bottom right quadrant, they should focus on improving their attacking because it was the main issue hindering both teams from getting points from clean sheets. The same argument could be applied to Aldershot and Morecambe as well since they are at the bottom half of the league table. Port Vale didn’t show why they can be the top of league table in this chart because they were weak in producing clean sheets. However, their efficiency is better than Gillingham by getting more points per clean sheet game.
To conclude, keeping clean sheets is a strong indicator of a team’s defending ability. However, it’s not only keeping clean sheets that’s important, but also how the team managed to get points from clean sheets. Therefore, by dividing 24 teams into four quadrants showing different characteristics, we can understand why some teams are doing better than others and which aspects (attacking or defending) should be the main focus point for team improvement.

