Category Archives: Barnet
League 2 2012/13 review: Time Analysis
There were 1411 League 2 goals in the 2012/13 season. This article will focus on the time at which goals were scored during match play. These are important information because it shows the characteristics of different teams. I did a time analysis once in December, 2013. That result showed that there was a systematic and significant upward trend in the number of goals scored as time progressed. This time all the goals in 2012/13 season were included and the upward trend is still the same. It further supports the previous research suggesting an increase in the frequency of goals scored as a match progresses (Jinshan et al., 1993; Reilly, 1996). The methodology is the same as I divided the 90 minutes into six 15-min periods. The following chart shows when the 1411 goals were scored in League 2 this season.
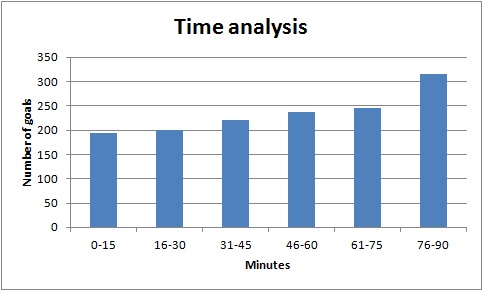
The goals scored in the last 15 minutes of the game were obviously more than other periods.
The following table shows the number of goals scored in six periods of different teams. The data were shown in a Red-Yellow-Green colour scale. That means, the higher number would be highlighted by red and the lower number would be highlighted by green for better visualisation of the data.

Gillingham, Wycombe and Bristol Rovers were the teams which started the game strongly in the first 15 minutes by scoring 14, 13 and 12 goals. Gillingham showed a special characteristic as they scored more goals in first half (39 goals) than second half (27 goals) significantly. They scored least goals in the last quarter (7 goals) which was different from the general trend of other teams which scored most goals in the last quarter. York City was another team having the same characteristic because their first half goals (31) were much more than that in second half (19).
Northampton scored most goals (19) in the last quarter but generally most of the team scored more goals in the last quarter so the difference was not significant. Port Vale showed something special as they significantly outperformed other teams in the second quarter (16-30 mins) by scoring 17 goals while most of the teams had less than 10 goals in this period.
Wycombe was a special team as well because they were particulary strong in the first 15 minutes of the halves by scoring 12 goals in 0-15 and 45-60 minutes. In other periods they scored only 6 to 7 goals.
However, if we just count the goals scored, it is not showing the whole picture of analysis because stronger teams scored more goals (e.g. Port Vale scored 87 goals and Aldershot scored 42 goals). If we want to find the characteristics of the teams, we have to convert these data into percentage which is shown by the following table.
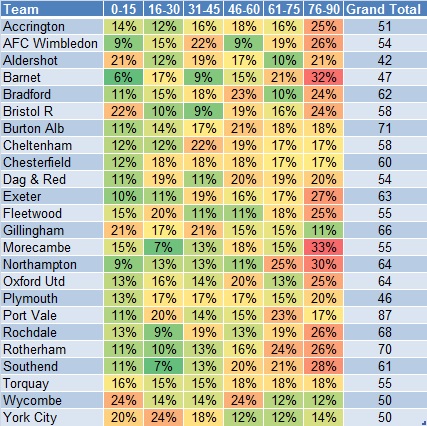
Only 5 teams scored 20% or more goals in the first 15 minutes of the game and they were Aldershot, Bristol Rovers, Gillingham, Wycombe and York City. AFC Wimbledon, Cheltenham and Gillingham were stronger in the 15 minutes before the first half break as they had 22%, 22% and 21% of goals in that period.
Barnet was the weakest team in the first 15 minutes (6%) but they were very strong in the last quarter with 32% scored within the last 15 minutes of the game. Morecambe and Northampton were the two remaining teams which had more than 30% of goals in the last quarter. If we consider the last 30 minutes of the game, the characteristics of these teams were more significant. Barnet and Northampton had 53% and 55% of goals scored in the last 30 minutes of the game and these could be important information for their opponents.
Aldershot and Bristol Rovers shared the same characteristic as they were both strong in the first and last quarters having more than 20% of total number of goals. The team with the most evenly distributed number of goals in all six quarters was Torquay. They had around 15%-18% of goals in each quarter.
To conclude, the characteristics of the teams could be shown by having the time analysis. Some teams were stronger in the first half (e.g. Gillingham and York City). Some teams were stronger in the last 30 minutes of the game (e.g. Barnet and Northampton). These information would be useful for the opposition analysis to know the strengths and weaknesses of the opponents.
Reference
Jinshan et al., 1993. Analysis of the goals in the 14th World Cup. In: J. C. a. A. S. T. Reilly, ed. Science and Football II. London: E. and F.N. Spon, pp. 203-205.
Reilly, T., 1996. Motion analysis and physiological demands. In: T. Reilly, ed. Science and Soccer. London: E. and F.N.Spon, pp. 65-81.
Share this:

League 2: How do teams score the first goal?
Last time, I wrote about the importance of the first goal (here). We know how important the first goal is, so the next question is “How can we score it?” Therefore, we will look at how the league 2 teams score their first goals. If you search in the internet, it is not difficult to find some findings about the general goal statistics. However, most of the goals were scored in different backgrounds and situations. Only the first goals are scored under the same circumstances: 0 – 0. Therefore, I think it is meaningful to look at the first goal statistics because it reflects the ability of teams to break the 0 – 0 situation. Please note that all the data of goals and league positions were updated to 22/10/2012.
All First Goals
The following chart shows how the teams scored all their first goals:

The goals were divided into five categories: open play, corner, free kick, penalty and throw-in. Here are the key findings:
- At least 50% of first goals were scored in open play in most teams except Aldershot, Bradford and Gillingham. Only 20% of first goals of Bradford were came from open play.
- Gillingham, which is leading the league, shows how strong they are in this chart. Not only they scored more first goals than the rest of the league, the more important point is they showed that they can score first goal in different ways (the only team which scored first goals in all five categories). They get both quantity and variety of first goals.
- Cheltenham is the second best. They scored 9 first goals in four categories.
- AFC Wimbledon, Bristol Rovers and York City scored all their first goals in open play. If you are play against them, it may be a good idea to be more aggressive in tackling to interrupt their open play because they are weak at scoring the first goal in set piece.
- If we look at the best 4 teams in this chart (Gillingham, Cheltenham, Chesterfield and Rochdale). Their league positions are 1st, 4th, 13th and 8th. I argue that strong at scoring first goal will bring teams to the top half of the table. However, it also depends on how good the team can retain their winning position. This topic was discussed last time.
Open Play First Goals
Then we focus on the open play goals first. The following chart shows how the teams scored the first goals in open play.

The goals were divided into four categories: right foot, left foot, header and other. Here are the key findings:
- Aldershot and Bradford are struggling in scoring open play first goal by scoring just once. However, it is worthy to note that Aldershot is in 23th and Bradford City is in 5th position.
- Barnet and Southend are the second worst by scoring 2 open play first goals. Barnet is in 24th and Southend is in 11th position. I argue that weak at scoring open play first goal will bring the teams to bottom zone but it is interesting to find out what Bradford and Southend did to bring them a decent league position.
- AFC Wimbledon and York City scored the most open play first goal by left foot.
- If we look at the best 5 teams in this chart (Chesterfield, York City, Fleetwood, Morecambe and Port Vale). Their positions are 13th, 12th, 3nd, 14th and 2nd). Only 2 out of 5 teams are in the first 7 positions which is playoff zone. I argue that strong at scoring open play first goal will bring the team to a mid table position at least but not enough to be the top 7 positions.
- Only 8 teams had scored open play first goals by header. 6 out of 8 teams are in the top half of the table. Gillingham and Fleetwood are the best and they are in the top 3 position in the league table. I argue that there is a relationship between them.
Set Piece First Goals
The following chart shows how the teams scored the first goals in set piece.

The goals were divided into four categories: right foot, left foot, header and penalty. Here are the key findings:
- Most of the teams scored 1 or 2 set piece first goal.
- Gillingham is overwhelming in this chart, performing much better than the rest of the league. Interestingly, there is no header and left foot goal within those 7 goals. Scoring set piece first goal is a strong weapon of Gillingham to be the leader of the league.
- Bradford is the strongest team in scoring by headers in set piece first goal.
- If we look at the best 4 teams in this chart (Gillingham, Bradford, Cheltenham and Rochdale). Their league positions are 1st, 5th, 4nd and 8nd). All of them are in top half of the table. 3 out of 4 teams are in the top 7 positions which is playoff zone. I argue that strong at scoring set piece first goal will bring the team to the top 7 positions.
Conclusions:
- At least 50% of first goals were scored in open play in most teams except Aldershot, Bradford and Gillingham
- Gillingham and Cheltenham can score first goals through different ways and they are the two best team of scoring first goal
- Strong at scoring first goal will bring teams to the top half of the table
- AFC Wimbledon and York City scored the most open play first goal by left foot
- Only 8 teams had scored open play first goals by header. 6 out of 8 teams are in the top half of the table
- Weak at scoring open play first goal will bring the teams to bottom zone. Aldershot and Barnet are the examples
- Most of the teams scored 1 or 2 set piece first goal
- Gillingham is overwhelming in scoring set piece first goal
- Bradford is the strongest team in scoring by headers in set piece first goal
- Strong at scoring set piece first goal will bring the team to the top 7 positions
Scoring first goal is not everything, it is also important to retain the winning position which was discussed in the last article (here).

