Blog Archives
Northampton – Stoke City in League 2? (Part 2)
In part 1, I have compared Northampton’s performance with other teams in League 2. It was clear that Northampton was strong in set play, particularly throw-in. Over 50% of their goals were from set play. In their set play goals, around 40% of them came from throw-ins. I will focus on analysing those 13 throw-in goals in this piece.
Time Analysis

No matter we consider the throw-in goals or all goals of Northampton; they both fit the general trend of time analysis in League 2 because more goals were scored in the later stage of the game. However, the key point is about the time slot of 76-90 minutes. 29.7% of goals were scored in this time slot in all goals. On the other hand, 38.5% of throw-in goals were scored in this time slot considering that the percentages in other time slots were only 15% at most. It shows that throw-in was an effective strategy for Northampton to use in the last 15 minutes of the game to score goals.
What were the assist styles?
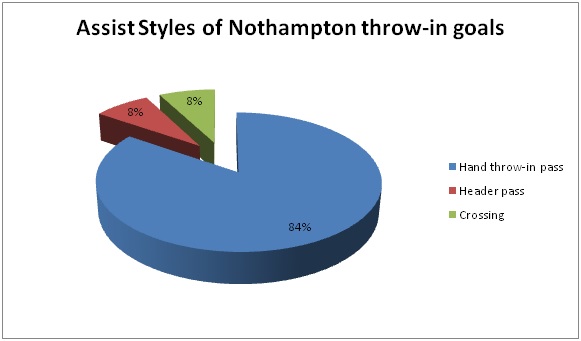
Considering the assist styles, some teams may choose to do flick-on headers to make assist. In Northampton’s case, the best way to make assist is to make a direct throw-in passing by hands. 84% of the throw-in goals were assisted by hand passes, only 8% of them were assisted by flick-on header. It also means that at least 84% of the goals were scored by one-touch shot. The technical ability to make one-touch shot is one of the keys to score throw-in goals.
Goal Type

Many people may link throw-in goals to headers but it is not the case in Northampton. Even we found out that one-touch shot is important, the above chart shows that using feet to shoot is as important as header in scoring throw-in goals. Header goals were only 8% more than feet goals. If we consider the above two charts together, we realise that considerable amount of goals were scored by hand passing throw-in followed by shots made by feet. It may be a result not expected by some people.
Where were the assists made?
Since 84% of assists were from direct hand throws, only 7.7% of assists were from central area by flick-on header. It is worthy to note that 30.8% of assists were outside 18-yard from the goal line. Some teams may only use long throw tactics near penalty area but Northampton’s statistics show that it is worthy to do long throw outside the penalty area also.
Who scored the most throw-in goals?

Northampton did not rely on any particular player to score throw-in goals as the goals were widely distributed to 8 players. A Akinfenwa is the player who scored the most with 31% of throw-in goals considering he is a striker. The other 7 players scored 1 goal each. It is worthy to note that 15% (2 goals) were scored by own goals. It shows that one of the advantages in using long throw-in is to mess up the situation in penalty area so the defenders would have a higher chance to make a mistake scoring own goal.
Where they scored?

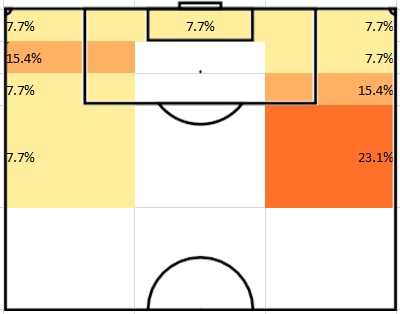
The above diagram obviously shows that the prime area for attacking long throws is the 12-yard area from the goal line. 84.6% of goals were scored in these two zones. Note that 15.4% of goals were scored outside the penalty area. My explanation is that most of the defenders would try to defend long throw-in by staying at the zones in front of the goal. It leaves space outside the penalty area for attackers to make long shot. It is worthy to note that no goal was scored in 12-18 yard area. It is because this zone is neither close enough for one-touch shot in long throws nor having enough space and time for players to make long shot.
Conclusion
By analysing Northampton’s strategy in throw-ins, we can identify why they are so strong in scoring throw-in goals. Firstly, they used a very direct style to attack. They didn’t prefer flick-on header as 84% of assists were came from direct hand throw-in passes. Secondly, one-touch shot is the key to score but we should be aware that using feet to score is almost as important as using header. Thirdly, Northampton did not rely on any particular player to be the target man to score throw-in goals. They had 8 players to score 11 throw-in goals (the other 2 goals were own goals). Fourthly, don’t ignore the importance of making delivery outside the penalty area (18-yard line) because 30% of their throw-in goals were delivered from zones outside the 18-yard line.
Share this:

Northampton – Stoke City in League 2? (Part 1)
Stoke City is famous for their long throw-ins attacking strategy. It is a different kind of attack for the defenders who get used to crosses. It is also a big question for the keepers whether they should stay at the goal line or not. There are some pieces which analyse Stoke’s performance. Is there any other team having the same strategy in English football? Northampton may be the team with similar (or even better) performance in long throw-ins.
Top 5 teams in set play goals in League 2
Considering the number of set play goals, Northampton scored the most set play goals (34 goals). The following table shows the open play and set play goals of 24 League 2 teams this season and highlights the top 5 teams in set play goals. They are AFC Wimbledon, Bradford, Cheltenham, Gillingham and Northampton.

In order to analyse how important set play goals are to different teams, the percentage of set play goals were considered also. The following table shows the percentages of open play and set play goals of 24 League 2 teams this season.
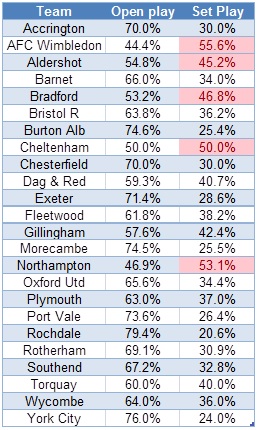
For example, being the League 2 Champion, Gillingham scored 28 set play goals but there were stronger in scoring open play goals. Therefore, set play goals only accounted for 42.4% of their total goals. The top 5 teams with the highest percentage of set play goals were AFC Wimbledon, Aldershot, Bradford, Cheltenham and Northampton. Northampton is the 2nd place in set play goal percentage. 53.1% of their goals were set play goals. Comparing both tables to each other, we can identify that 4 teams existed in the top 5 positions in both tables. They are AFC Wimbledon, Bradford, Cheltenham and Northampton. That means these 4 teams were good at scoring set play goals and set play goals were more important to them. Note that Northampton and AFC Wimbledon are the only two teams scoring more set play goals than open play goals.
Throw-ins goals in League 2
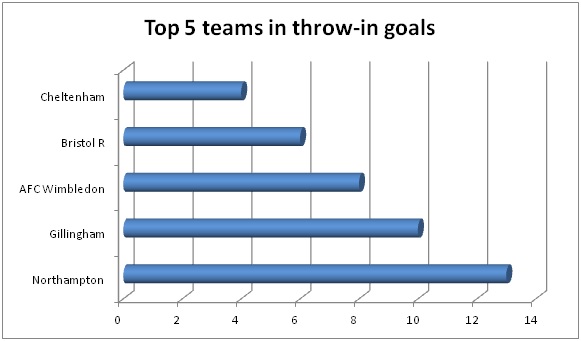
This chart shows how strong Northampton was in throw-in goals. With most of the teams having 3 throw-in goals or less, Northampton scored 13 throw-in goals this season. They scored 100% more than the 4th place Bristol Rovers having 6 throw-in goals. The great difference shows that scoring throw-in goals was a strong weapon of Northampton while most of the teams didn’t have the ability to do so.
If we consider how important throw-in goals are within set play goals, Northampton is still the team showing the highest percentage. 38.24% of their set play goals were throw-in goals. It showed how important throw-in goals were to Northampton.

In fact, Gillingham and Northampton were the only 2 teams with more than 30% of their set play goals as throw-in goals. Considering only 9 teams in the league having more than 10% of their set play goals as throw-in goals, it shows how Northampton outperformed other teams by having 38.24%.
No matter we consider the number of throw-in goals or the percentage of throw-in goals, Northampton is still the best team in the league and they obviously outperformed other teams in the league.
I don’t have the goal scoring data of Stoke City this season. However, I wonder Stoke City can achieve the two conditions of Northampton or not.
- More than 50% of goals were set play goals
- Around 40% of set play goals were throw-in goals
In part 2, the focus will be analysing the details of Northampton’s throw-in goals. It includes when they scored, how they scored, where they scored, where the assists came from, etc.

