Blog Archives
Header Goals Analysis of League 2 – Part 1
How important are the header goals in League 2? Most of the goals are scored by right foot, left foot or head but they are not evenly distributed. Updated to 3/1/2013, there were 948 goals in League 2. 44% of them were scored by right foot, 25% by left foot, 21% by header and 10% of goals were scored by other parts of the body or by penalty. In short, around 1 out of 5 goals were scored by header. It fits the argument of Hughes (1990) saying that about 1 goal in every 5 overall was scored with a header in the book “The Winning Formula”.

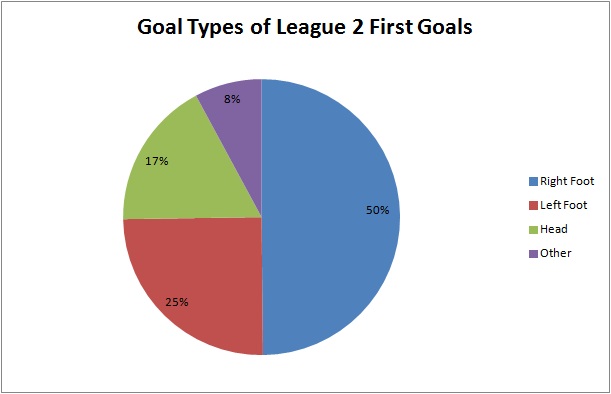
On the other hand, I explained the importance of first goal before so let’s look at the impact of header goal in League 2 first goals. There were 317 first goals and 17% of them were scored by header. That means it was less likely to score first goal by header while the impact of right foot was increased to 50%. It shows that attacking in header may not be a good choice to score first goal in League 2.
If we focus on the 200 header goals which is shown in the following chart, 54% of header goals were came from set play while 46% of them came from open play.

The above chart shows that header goals were scored more in set play (54%) than in open play (46%). Corner is the main source of header goals in set play, having 29% of total header goals. The importance of header goals is more obvious if the data is normalised by considering the total number of open play and set play goals.

There were 619 open play goals in League 2. The number of open play goals was more than that of set play goals. Even 46% of header goals were from open play, it only took 15% of total open play goals. It shows that the impact of header goals was not obvious because 84% of open play goals were scored by feet, particularly more than half (55%) were scored by right foot. It shows that if a team want to score open play goals, they should focus working more on their feet rather than header.
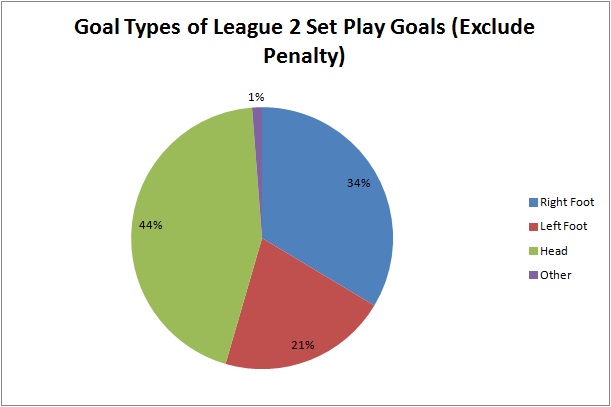
On the other hand, there were 244 set play goals (exclude penalty) in League 2. 54% of header goals were came from set play and it took 44% of set play goals. It highlights the importance of header goals in set play comparing with the situation in open play goals shown in previous chart. It gives a clue for the teams which are stronger at header. They should focus more on attacking in set play because it will give 29% more chance to score by header. However, it is worthy to note that even header goals were more important in set plays; it still took less than half of set play goals. In other words, more than half of the set play goals were scored by feet. It is very important for the practice of set play in training as they may only focus on attacking by headers. However, statistics show that the goals scored by feet in set plays were more than that by headers.
In this post, only open play header goals would be analysed. The analysis of set play header goals would be discussed next week because there are 3 types of set play (corner, free kick and throw-in) to be analysed.
Open Play Header Goals
Crossing was the main source of open play header goals because 85% of them were assisted by cross.

The remaining 15% were assisted by passing or shots. It indicated that there is a close relationship between crossing and header goals.
Some people may argue that the prime goal scoring area of header goal in open play is the 6-yard box because it is closer to the goal. However, it is not the case in League 2.
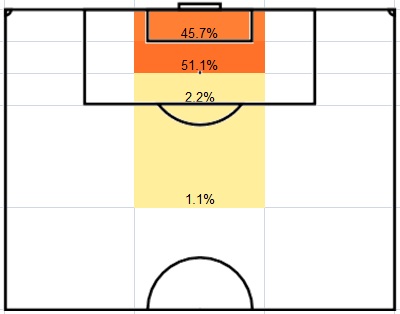
Figure 1: Where open play header goals were scored
The above diagram shows that more than half (51.1%) of the open play header goals were scored in the 6-12 yard area while 45.7% of them were scored in 6-yard box. It is similar to the argument of Hughes (1990). He argued that the “prime target area” extends out 8 yards, from 2 yards inside the 6-yard box to the penalty spot, and across 20 yards, the width of the 6-yard box. In this analysis, it shows that the prime scoring area of header goals is the 12-yard area from the goal to the penalty spot. For any header shots made behind the penalty spot, the probability of scoring decreased dramatically because only 3.3% of open play header goals were scored behind the penalty spot.
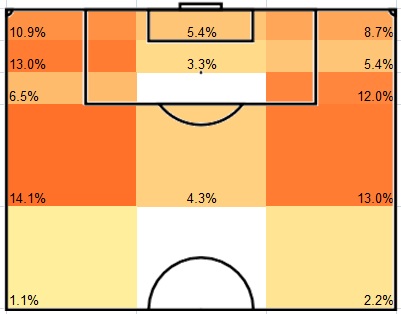
Figure 2: where open play header goals were assisted
From previous finding, crossing was the main source of assist to open play header goals. Therefore, it is not surprised to see that most of the assists were come from both flanks. Horizontally, there is not much difference between the right and left side which took 41.3% and 45.7% of assists. On the other hand, there were differences by analysing vertically. The assists made from the 18-yard area from the goal (65.2%) were much more than that from the zones outside the penalty area (31.5%). It is worthy to note that if the ball is delivered outside the final third of the pitch, it is much less likely to score by header because only 3.3% of assists were came from outside the final third of the pitch. If the delivery is come from the right side, the best delivery would be crossing from wide or deep because they took 12% and 13% of assist. The pattern would be different in the left side. Crossing near the goal line was better.
Conclusion
By combining the 3 points mentioned above, the best formula to score open play header goals in League 2 was found. It should be assisted by crossing. The ball should be delivered into the 12-yard area from the goal. The delivery area should be the final 18-yard area from the goal at both flanks. On the other hand, header goals were more important in set play than in open play. However, the importance of header goals should not be over-emphasised because over half of the set play goals were scored by feet.
The set play header goals would be analysed next week.
Reference
HUGHES, C., 1990. The Winning Formula. London: Collins
Share this:

League 2: How do teams score the first goal?
Last time, I wrote about the importance of the first goal (here). We know how important the first goal is, so the next question is “How can we score it?” Therefore, we will look at how the league 2 teams score their first goals. If you search in the internet, it is not difficult to find some findings about the general goal statistics. However, most of the goals were scored in different backgrounds and situations. Only the first goals are scored under the same circumstances: 0 – 0. Therefore, I think it is meaningful to look at the first goal statistics because it reflects the ability of teams to break the 0 – 0 situation. Please note that all the data of goals and league positions were updated to 22/10/2012.
All First Goals
The following chart shows how the teams scored all their first goals:

The goals were divided into five categories: open play, corner, free kick, penalty and throw-in. Here are the key findings:
- At least 50% of first goals were scored in open play in most teams except Aldershot, Bradford and Gillingham. Only 20% of first goals of Bradford were came from open play.
- Gillingham, which is leading the league, shows how strong they are in this chart. Not only they scored more first goals than the rest of the league, the more important point is they showed that they can score first goal in different ways (the only team which scored first goals in all five categories). They get both quantity and variety of first goals.
- Cheltenham is the second best. They scored 9 first goals in four categories.
- AFC Wimbledon, Bristol Rovers and York City scored all their first goals in open play. If you are play against them, it may be a good idea to be more aggressive in tackling to interrupt their open play because they are weak at scoring the first goal in set piece.
- If we look at the best 4 teams in this chart (Gillingham, Cheltenham, Chesterfield and Rochdale). Their league positions are 1st, 4th, 13th and 8th. I argue that strong at scoring first goal will bring teams to the top half of the table. However, it also depends on how good the team can retain their winning position. This topic was discussed last time.
Open Play First Goals
Then we focus on the open play goals first. The following chart shows how the teams scored the first goals in open play.

The goals were divided into four categories: right foot, left foot, header and other. Here are the key findings:
- Aldershot and Bradford are struggling in scoring open play first goal by scoring just once. However, it is worthy to note that Aldershot is in 23th and Bradford City is in 5th position.
- Barnet and Southend are the second worst by scoring 2 open play first goals. Barnet is in 24th and Southend is in 11th position. I argue that weak at scoring open play first goal will bring the teams to bottom zone but it is interesting to find out what Bradford and Southend did to bring them a decent league position.
- AFC Wimbledon and York City scored the most open play first goal by left foot.
- If we look at the best 5 teams in this chart (Chesterfield, York City, Fleetwood, Morecambe and Port Vale). Their positions are 13th, 12th, 3nd, 14th and 2nd). Only 2 out of 5 teams are in the first 7 positions which is playoff zone. I argue that strong at scoring open play first goal will bring the team to a mid table position at least but not enough to be the top 7 positions.
- Only 8 teams had scored open play first goals by header. 6 out of 8 teams are in the top half of the table. Gillingham and Fleetwood are the best and they are in the top 3 position in the league table. I argue that there is a relationship between them.
Set Piece First Goals
The following chart shows how the teams scored the first goals in set piece.

The goals were divided into four categories: right foot, left foot, header and penalty. Here are the key findings:
- Most of the teams scored 1 or 2 set piece first goal.
- Gillingham is overwhelming in this chart, performing much better than the rest of the league. Interestingly, there is no header and left foot goal within those 7 goals. Scoring set piece first goal is a strong weapon of Gillingham to be the leader of the league.
- Bradford is the strongest team in scoring by headers in set piece first goal.
- If we look at the best 4 teams in this chart (Gillingham, Bradford, Cheltenham and Rochdale). Their league positions are 1st, 5th, 4nd and 8nd). All of them are in top half of the table. 3 out of 4 teams are in the top 7 positions which is playoff zone. I argue that strong at scoring set piece first goal will bring the team to the top 7 positions.
Conclusions:
- At least 50% of first goals were scored in open play in most teams except Aldershot, Bradford and Gillingham
- Gillingham and Cheltenham can score first goals through different ways and they are the two best team of scoring first goal
- Strong at scoring first goal will bring teams to the top half of the table
- AFC Wimbledon and York City scored the most open play first goal by left foot
- Only 8 teams had scored open play first goals by header. 6 out of 8 teams are in the top half of the table
- Weak at scoring open play first goal will bring the teams to bottom zone. Aldershot and Barnet are the examples
- Most of the teams scored 1 or 2 set piece first goal
- Gillingham is overwhelming in scoring set piece first goal
- Bradford is the strongest team in scoring by headers in set piece first goal
- Strong at scoring set piece first goal will bring the team to the top 7 positions
Scoring first goal is not everything, it is also important to retain the winning position which was discussed in the last article (here).
Share this:

England League 2: How important is the first goal?
Performance analysis is usually thought as an elite tool which is for big clubs and high level leagues only because big clubs have the resources to afford analysis software and different IT technological support. In my opinion, it should not be the case. Performance analysis is a process which can be done by small football clubs also. Small clubs don’t have the big budget to do as much as the big clubs do but we are going through the same process. That’s why I would like to share my experience and work of doing performance analysis in a League 2 club.
No doubt, everybody knows the first goal is important. However, do they know how important it is? How to transfer the concept of “importance” to a quantified stuff, such as points? Different leagues have different levels; we can’t apply all the findings in Premier League to League 2 as there are so many differences such as playing styles, distance covered, etc. I would quantify the concept of “importance” by making statistics about the points got at the end of the game by a team when they scored or conceded the first goal. I would call it as “expected points” which means the points a team expected to get from the first goal. I would use different perspectives to analyse the first goal in league 2:
- Time of goal
- Match location (Home or Away)
- League position (In groups)
- Team
Average
I used the first 8 league games in each team, which means 95 games in total (the game between Wycombe and Bristol Rovers on 25/8 was excluded as it was abandoned 66 minutes). Among these 95 games, 86 games had goal(s). The following chart shows that the expected points of scoring first and conceding first are 2.30 and 0.49 in average. These would be used as a reference for other results found by using different perspectives.

Time of Goal
Time is an important factor of first goal. I divide 90 minutes into 6 categories, which mean 15 minutes per category.

Teams got most expected points (3 points) when they scored the first goal in 76-90 minutes. It is reasonable as there is not much time for the opponent to fight back. However, there were only 2 goals scored in this timeslot which makes this finding not so persuasive since the sample size is not big enough. I’d rather to ignore this timeslot. Teams could get high expected points if they score the first goal between 16 to 45 minutes, 30 minutes timeslot before the interval. Since the expected points drops after 45 minutes, the first goal scored within 30 minutes before half time are more valuable than first goal scored 30 minutes after half time. I heard argument that scoring before the interval is a great advantage but statistics in this chart showing that the expected points from 16-30 minutes and 31-45 minutes are similar. However, a similar argument may be right. Scoring before the interval is particularly damaging to the opposition. As you can see from the chart, teams conceding first goal just before half time could only get 0.29 expected points which is obviously less than conceding first goal in other timeslots which fits the argument. Nobody would like to concede an early goal but statistics show that the team don’t have to be pessimistic even they do concede an early goal within 1-15 minutes. Teams can get 0.64 expected points which is the highest comparing with other timeslots. This can be explained that the team still have much time to bounce back.
Location

From the above chart, teams scoring the first goal in home were more likely to keep the winning positions and get more points than scoring first in away game. It may be explained by home advantage that teams play better in home. However, the same argument can’t be applied in conceding first because they both got 0.49 expected points. Home advantage may help the team more to keep winning position but not bouncing back from behind.
League Position

Note that the league positions are updated to 1/10. In scoring first (blue columns), an obvious downward trend can be seen which shows that stronger teams were more likely to retain their winning position when scoring first. There is a big gap difference (0.51 expected points) between positions 1-6 and positions 7-12. Another big gap difference (0.49 expected points) appears in between positions 7-12 and positions 13-18. However, there is not much difference (0.11 expected points) between positions 13-18 and positions 19-24. I would say in terms of the ability to retain winning position after scoring first, there are 3 levels in league 2. Positions 13-24 would be at more or less the same level. Positions 7-12 are much better than the bottom half of the table but positions 1-6 are much better than positions 7-12 as well.
The downward trend can’t be seen in considering the conceding first (red columns). Positions 13-18 got a better result than positions 7-12, similar to positions 1-6. In fact, it surprises me a little bit as I expected the downward trend in conceding first same as scoring first. We would look at individual teams afterwards to see what we can find. However, the expected points from positions 19-24 (0.16 points) are obviously less than other groups. It shows that they struggle to bounce back if they concede the first goal.
Team

The tables are listed according to the league position (updated to 1/10). The above table is about scoring first. The first 8 teams in the league table all scored first goals for at least 4 times. Among these 8 teams, 4 of them get expected points of 3 which means that whey they scored first, they kept the winning position and won the game every time. Gillingham scored first goal in 7 out of 8 games which is a brilliant result. Moreover, they retained and won all those 7 games which make them the best in league 2. Rochdale performed very well since they scored first goal 6 times, which is the second best. However, their weakness is to retain the winning position because they can only get 1.8 expected points, which is the worst in the top half of the table. Plymouth scored first goal twice but they get only 0.5 expected points per game which means they couldn’t won a game even they scored first. This result is the worst in the league. We would look at the conceding first in the following table.

Although Plymouth is the worst team in retaining winning position, they are the strongest team in the league 2 to bounce back from conceding first. They conceded first goal four times, but they bounced back and won the game twice so they got 1.5 expected points per game, which is 50% better than a draw. This is the best result in the league 2. Exeter and Torquay are the second best teams, getting 1.3 expected points. It is worthy to note that Torquay and Plymouth are at the 15th and 16th of the table, but they are the two best team to bounce back from conceding first. This can explain why in the league position chart positions 13-18 performs surprisingly better than expected.
Conclusion:
- Scoring in 16-30, 31-45 minutes (30 minutes before half time) can get higher expected points
- Conceding 15 minutes before half time would be the worst time to concede the first goal
- Playing in home is more likely to retain the winning position
- In terms of bouncing back, there is no difference in playing home and away games
- The 12 teams in the top half of league table are much better in retaining winning position than the bottom half of the table. Among those 12 teams in the top half of table, the first 6 teams are significantly better than positions 7-12 teams.
- Positions 19-24 teams are obviously weak in bouncing back when conceding first
- Gillingham is the strongest team to score first and retain the winning position
- Rochdale is strong in scoring first but weak at retaining the winning position to the end of the game
- Plymouth is a special team. They are the worst team in scoring first and get only 0.5 expected points. However, they are the strongest team in bouncing back from conceding first, getting 1.5 expected points.
This is my first analysis article about league 2. I will write at least a few more articles about league 2 this season.

