Blog Archives
Header Goals Analysis of League 2 – Part 1
How important are the header goals in League 2? Most of the goals are scored by right foot, left foot or head but they are not evenly distributed. Updated to 3/1/2013, there were 948 goals in League 2. 44% of them were scored by right foot, 25% by left foot, 21% by header and 10% of goals were scored by other parts of the body or by penalty. In short, around 1 out of 5 goals were scored by header. It fits the argument of Hughes (1990) saying that about 1 goal in every 5 overall was scored with a header in the book “The Winning Formula”.

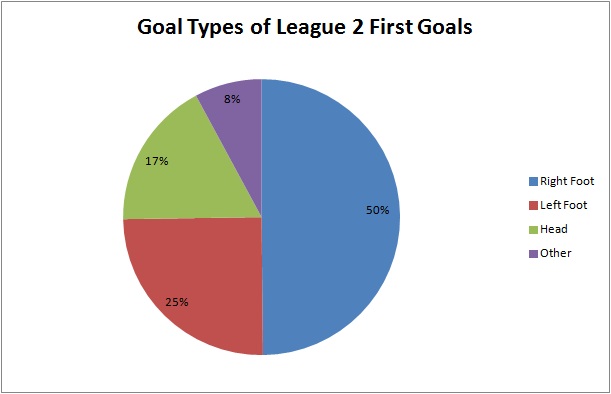
On the other hand, I explained the importance of first goal before so let’s look at the impact of header goal in League 2 first goals. There were 317 first goals and 17% of them were scored by header. That means it was less likely to score first goal by header while the impact of right foot was increased to 50%. It shows that attacking in header may not be a good choice to score first goal in League 2.
If we focus on the 200 header goals which is shown in the following chart, 54% of header goals were came from set play while 46% of them came from open play.

The above chart shows that header goals were scored more in set play (54%) than in open play (46%). Corner is the main source of header goals in set play, having 29% of total header goals. The importance of header goals is more obvious if the data is normalised by considering the total number of open play and set play goals.

There were 619 open play goals in League 2. The number of open play goals was more than that of set play goals. Even 46% of header goals were from open play, it only took 15% of total open play goals. It shows that the impact of header goals was not obvious because 84% of open play goals were scored by feet, particularly more than half (55%) were scored by right foot. It shows that if a team want to score open play goals, they should focus working more on their feet rather than header.
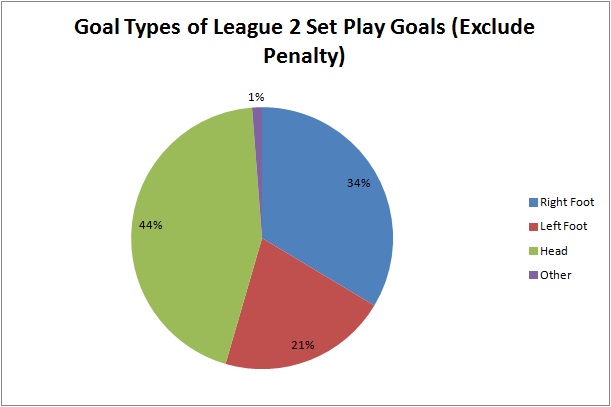
On the other hand, there were 244 set play goals (exclude penalty) in League 2. 54% of header goals were came from set play and it took 44% of set play goals. It highlights the importance of header goals in set play comparing with the situation in open play goals shown in previous chart. It gives a clue for the teams which are stronger at header. They should focus more on attacking in set play because it will give 29% more chance to score by header. However, it is worthy to note that even header goals were more important in set plays; it still took less than half of set play goals. In other words, more than half of the set play goals were scored by feet. It is very important for the practice of set play in training as they may only focus on attacking by headers. However, statistics show that the goals scored by feet in set plays were more than that by headers.
In this post, only open play header goals would be analysed. The analysis of set play header goals would be discussed next week because there are 3 types of set play (corner, free kick and throw-in) to be analysed.
Open Play Header Goals
Crossing was the main source of open play header goals because 85% of them were assisted by cross.

The remaining 15% were assisted by passing or shots. It indicated that there is a close relationship between crossing and header goals.
Some people may argue that the prime goal scoring area of header goal in open play is the 6-yard box because it is closer to the goal. However, it is not the case in League 2.
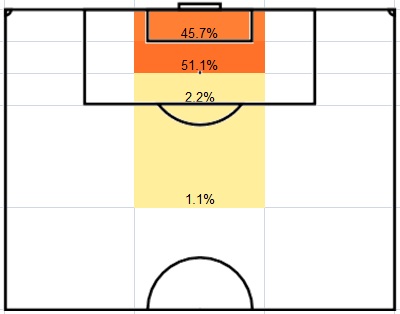
Figure 1: Where open play header goals were scored
The above diagram shows that more than half (51.1%) of the open play header goals were scored in the 6-12 yard area while 45.7% of them were scored in 6-yard box. It is similar to the argument of Hughes (1990). He argued that the “prime target area” extends out 8 yards, from 2 yards inside the 6-yard box to the penalty spot, and across 20 yards, the width of the 6-yard box. In this analysis, it shows that the prime scoring area of header goals is the 12-yard area from the goal to the penalty spot. For any header shots made behind the penalty spot, the probability of scoring decreased dramatically because only 3.3% of open play header goals were scored behind the penalty spot.
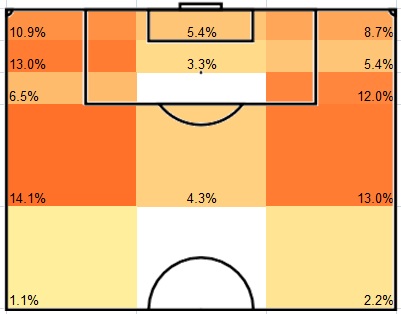
Figure 2: where open play header goals were assisted
From previous finding, crossing was the main source of assist to open play header goals. Therefore, it is not surprised to see that most of the assists were come from both flanks. Horizontally, there is not much difference between the right and left side which took 41.3% and 45.7% of assists. On the other hand, there were differences by analysing vertically. The assists made from the 18-yard area from the goal (65.2%) were much more than that from the zones outside the penalty area (31.5%). It is worthy to note that if the ball is delivered outside the final third of the pitch, it is much less likely to score by header because only 3.3% of assists were came from outside the final third of the pitch. If the delivery is come from the right side, the best delivery would be crossing from wide or deep because they took 12% and 13% of assist. The pattern would be different in the left side. Crossing near the goal line was better.
Conclusion
By combining the 3 points mentioned above, the best formula to score open play header goals in League 2 was found. It should be assisted by crossing. The ball should be delivered into the 12-yard area from the goal. The delivery area should be the final 18-yard area from the goal at both flanks. On the other hand, header goals were more important in set play than in open play. However, the importance of header goals should not be over-emphasised because over half of the set play goals were scored by feet.
The set play header goals would be analysed next week.
Reference
HUGHES, C., 1990. The Winning Formula. London: Collins
Share this:

Analysis of top 4 strikers in League 2 (1)
Different strikers have their own characteristics in scoring goals. They can somehow reflect their teams’ goal scoring characteristics as well. We will focus on the top 4 goal scorers in League 2. The analysis is quite long so I divide it into two posts. The second part will be continued next week. The following table shows who they are, their team and the position in league table. Please note that all the data is updated to 28/12/2012.
|
Name |
No. of goals |
Team |
Team league position |
|
T Pope |
20 |
Port Vale |
2nd |
|
J Cureton |
16 |
Exeter |
10th |
|
A Akinfenwa |
13 |
Northampton |
11th |
|
N Wells |
12 |
Bradford |
5th |
It seems that being a top team does not necessarily need a top goal scorer as only 2 of the top 4 strikers are playing for a team in the top 7 of the table which is the promotion playoff line. The other 2 strikers are playing for the teams in the mid-table position. However, I agree that a high quality striker can bring an average team into a top team.

Although T Pope is the top goal scorer, he doesn’t have the highest percentage of team goals. J Cureton is the striker whom the team relies on the most because he scored 47% of the team goals. It is worthy to note that all 4 strikers scored more than one-third of the team goals.
Apart from looking at the number of goals, we should analyse by looking at the starting appearance as well in order to understand the efficiency of the strikers.

As the top league goal scorer, T Pope is the most efficient striker as well. He scored 0.87 goals per starting appearance. Note that J Cureton scored more goals than A Akinfenwa but A Akinfenwa is more efficient because he scored slight more goals than J Cureton in terms of goals per starting appearance.
We discussed how important the first goal before (here) so it is worthy to analyse the strikers’ ability to scored the first goal in the match.

A Akinfenwa performed much better than other strikers in terms of first goal. 46% of his goals were first goal, which is obviously higher than that of T Pope (30%) and J Cureton (31%). His percentage of first goal is almost double the percentage of N Wells (25%). This is A Akinfenwa’s strength and people may ignore it if we don’t analyse the strikers from this perspective.
Then we move on to analyse the relationship between open play and set play goals.
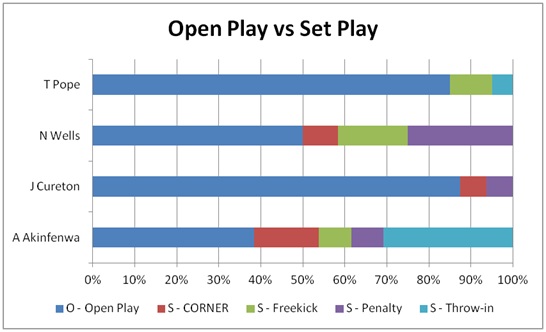
T Pope (85%) and J Cureton (88%) scored most of their goals in open play, obviously higher than the percentage of other two strikers. N Wells struck a balance by scoring 50% open play goals. However, 25% of his goals were come from penalties. A Akinfenwa is particularly strong at scoring set play goals as 62% of his goals were from set play. Note than 31% of his goals were from throw-in which is much higher than other strikers. Moreover, he scored the highest percentage of goals in corner (15%) as well. He is a good example showing that the team top goal scorer can reflect the goal scoring characteristic of the team. Northampton scored more goals in set play (53%) than open play (47%). In all 18 set play goals, 50% of them were came from throw-in. The goal scoring pattern of Northampton and A Akinfenwa is almost the same even he scored only 35% of team goals.
Then we will analyse how the strikers scored the goals.
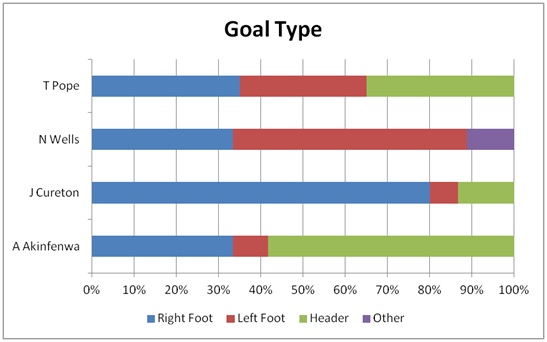
Note that I have excluded the goals from penalty in this chart. T Pope shows he is an all-round striker and this may explain why he is leading goal scoring table. The goals he scored by using his right foot (35%), left foot (30%) and head (35%) were almost evenly distributed. J Cureton is particularly strong at scoring goals by right foot (80%). However, it can be treated as a weakness as well because it is easier for the defender to mark him. N Wells is weak at header as he hasn’t scored any goal by header. However, he is strong at scoring goals by using both feet. A Akinfenwa is strong in air as he scored 58% of his goals by head. It fits what we find that he scored the highest percentage of goals from set play (62%) among 4 strikers, particularly in throw-in (31%) and corner (15%). In short, scoring goals by header in set play is the strongest weapon of A Akinfenwa.
The analysis will be continued next week by analysing these 4 strikers from different perspectives including where they scored, when they scored, where assist came from, assist types, shots total and shots on target.

