Category Archives: 2012/13 review
What is the most effective tactic to score corner goal in League 2?
In the book “Soccer Tactics and Skills”, Charles Hughes (1987) argued that the best way to score corner goal consists of 3 factors:
- Near post
- Inswing
- Keep it simple (Variety on a theme, not variety on sole criteria of doing something different)
By analysing 178 League 2 corner goals, it would be tested whether his argument can be applied to League 2 or not.
There is not much difference in terms of the sides of corner. 50.6% of corners were from the left side of the goal.

Type of delivery

The above chart shows that most of the corner goals were delivered by inswing (61%). 30% of them were outswing and 9% of them were ground pass which included medium or short corner. The finding fits the argument of Hughes that inswing is the best way to score corner goal.
Delivery target area
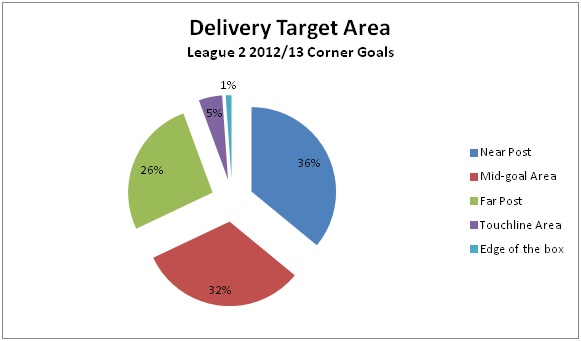
In terms of delivery target area, the result is not as dominant as the result of delivery type. Although near post was the most popular delivery target area, it was not dominant with 36%. In fact, the percentages of mid-goal area and far post were close with 32% and 26%. 5% of corners were delivered to touchline area which means they were short corners. Only 1% of corners were medium corner which were delivered to the edge of the box for long shots. By looking at this chart, Hughes’s argument about near post delivery is not very strong here because the difference between near post, mid-goal area and far post were within 10%. Near post is still a better choice but it is not a dominating factor as inswing delivery. Then the data would be compared with each other for in-depth analysis.
Which side vs. Type of delivery

The above chart shows that the preferences of delivery were different depending on which side of the corner it was. If the corner is taken at the left side of the goal, most of them were delivered by inswing. It could be explained by the fact that most of the players were right-footed. It is interesting to see which approach the team would use in the right side corner. 45 right side corner goals were delivered by inswing. That means teams chose a left-footed player to deliver the corner for the purpose of inswing delivery. However, 36 right side corner goals were delivered by outswing. This number is much more than the number of left side outswing corner (17). On the other hand, the numbers of ground pass delivery in both sides were similar. No matter which side we look at, inswing is still the most popular choice of delivery although it is more dominant in left side corner. In the right side corner, teams still prefer to do inswing delivery but there was considerable amount of outswing delivery also.
Type of delivery vs. Delivery target area

The above chart shows that inswing and near post combination scores the most corner goals (42). It fits the argument of Hughes. Another finding is that it is less likely to score corner goal at far post by outswing delivery (12 goals). The difference between inswing and outswing was less if the delivery target area is mid-goal area. The difference was 11 goals compared to the difference of near post (24 goals) and far post (23 goals). In short, for inswing delivery, it would be the best to deliver the ball to near post and far post, especially near post. For outswing delivery, it would be the best to deliver the ball to mid-goal area.
Keep it simple?
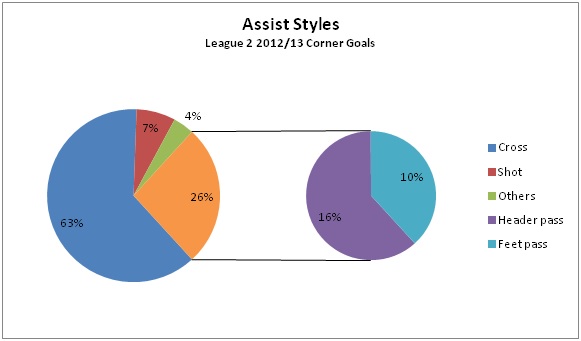
The result fits the argument of Hughes because 63% of corner goals were scored directly by the corner cross. 26% of corner goals were assisted by passing. Some teams may prefer to do flick-on headers to make assist but the data shows that it may not be a good choice because only 16% of corner goals were assisted by flick-on headers. If we consider passing assist only, flick-on header is a better choice than feet pass as shown in the chart with 6% more assists.
Conclusion
Reviewing the 3 factors mentioned by Hughes, I would say 2 of them were dominating factors in League 2: inswing delivery and keep it simple. They were proved by evidences. 61% of corner goals were delivered by inswing. 63% of corner goals were assisted by direct corner cross. However, the data shows that although near post is the best choice of delivery target area, it is not a dominating factor with 36% of corner goals delivered to near post. The same type of analysis could be applied to the data of different leagues and the results could be different.
Reference
HUGHES, C., 1987. Soccer Tactics and Skills. Great Britain: Queen Anne Press
Share this:

Northampton – Stoke City in League 2? (Part 2)
In part 1, I have compared Northampton’s performance with other teams in League 2. It was clear that Northampton was strong in set play, particularly throw-in. Over 50% of their goals were from set play. In their set play goals, around 40% of them came from throw-ins. I will focus on analysing those 13 throw-in goals in this piece.
Time Analysis

No matter we consider the throw-in goals or all goals of Northampton; they both fit the general trend of time analysis in League 2 because more goals were scored in the later stage of the game. However, the key point is about the time slot of 76-90 minutes. 29.7% of goals were scored in this time slot in all goals. On the other hand, 38.5% of throw-in goals were scored in this time slot considering that the percentages in other time slots were only 15% at most. It shows that throw-in was an effective strategy for Northampton to use in the last 15 minutes of the game to score goals.
What were the assist styles?
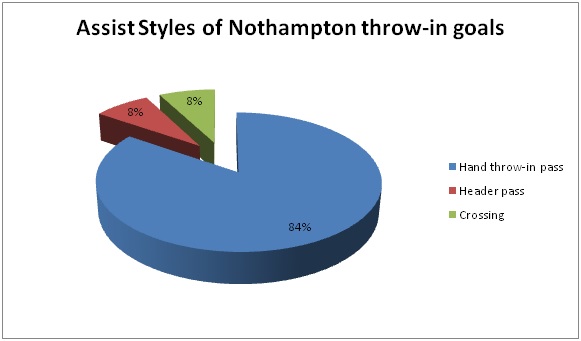
Considering the assist styles, some teams may choose to do flick-on headers to make assist. In Northampton’s case, the best way to make assist is to make a direct throw-in passing by hands. 84% of the throw-in goals were assisted by hand passes, only 8% of them were assisted by flick-on header. It also means that at least 84% of the goals were scored by one-touch shot. The technical ability to make one-touch shot is one of the keys to score throw-in goals.
Goal Type

Many people may link throw-in goals to headers but it is not the case in Northampton. Even we found out that one-touch shot is important, the above chart shows that using feet to shoot is as important as header in scoring throw-in goals. Header goals were only 8% more than feet goals. If we consider the above two charts together, we realise that considerable amount of goals were scored by hand passing throw-in followed by shots made by feet. It may be a result not expected by some people.
Where were the assists made?
Since 84% of assists were from direct hand throws, only 7.7% of assists were from central area by flick-on header. It is worthy to note that 30.8% of assists were outside 18-yard from the goal line. Some teams may only use long throw tactics near penalty area but Northampton’s statistics show that it is worthy to do long throw outside the penalty area also.
Who scored the most throw-in goals?

Northampton did not rely on any particular player to score throw-in goals as the goals were widely distributed to 8 players. A Akinfenwa is the player who scored the most with 31% of throw-in goals considering he is a striker. The other 7 players scored 1 goal each. It is worthy to note that 15% (2 goals) were scored by own goals. It shows that one of the advantages in using long throw-in is to mess up the situation in penalty area so the defenders would have a higher chance to make a mistake scoring own goal.
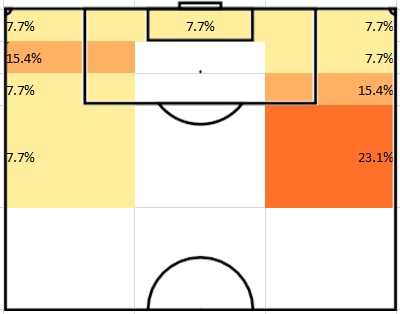
Where they scored?

The above diagram obviously shows that the prime area for attacking long throws is the 12-yard area from the goal line. 84.6% of goals were scored in these two zones. Note that 15.4% of goals were scored outside the penalty area. My explanation is that most of the defenders would try to defend long throw-in by staying at the zones in front of the goal. It leaves space outside the penalty area for attackers to make long shot. It is worthy to note that no goal was scored in 12-18 yard area. It is because this zone is neither close enough for one-touch shot in long throws nor having enough space and time for players to make long shot.
Conclusion
By analysing Northampton’s strategy in throw-ins, we can identify why they are so strong in scoring throw-in goals. Firstly, they used a very direct style to attack. They didn’t prefer flick-on header as 84% of assists were came from direct hand throw-in passes. Secondly, one-touch shot is the key to score but we should be aware that using feet to score is almost as important as using header. Thirdly, Northampton did not rely on any particular player to be the target man to score throw-in goals. They had 8 players to score 11 throw-in goals (the other 2 goals were own goals). Fourthly, don’t ignore the importance of making delivery outside the penalty area (18-yard line) because 30% of their throw-in goals were delivered from zones outside the 18-yard line.
Share this:

Northampton – Stoke City in League 2? (Part 1)
Stoke City is famous for their long throw-ins attacking strategy. It is a different kind of attack for the defenders who get used to crosses. It is also a big question for the keepers whether they should stay at the goal line or not. There are some pieces which analyse Stoke’s performance. Is there any other team having the same strategy in English football? Northampton may be the team with similar (or even better) performance in long throw-ins.
Top 5 teams in set play goals in League 2
Considering the number of set play goals, Northampton scored the most set play goals (34 goals). The following table shows the open play and set play goals of 24 League 2 teams this season and highlights the top 5 teams in set play goals. They are AFC Wimbledon, Bradford, Cheltenham, Gillingham and Northampton.

In order to analyse how important set play goals are to different teams, the percentage of set play goals were considered also. The following table shows the percentages of open play and set play goals of 24 League 2 teams this season.
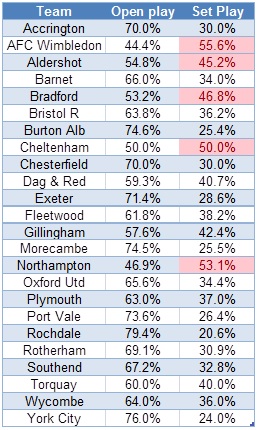
For example, being the League 2 Champion, Gillingham scored 28 set play goals but there were stronger in scoring open play goals. Therefore, set play goals only accounted for 42.4% of their total goals. The top 5 teams with the highest percentage of set play goals were AFC Wimbledon, Aldershot, Bradford, Cheltenham and Northampton. Northampton is the 2nd place in set play goal percentage. 53.1% of their goals were set play goals. Comparing both tables to each other, we can identify that 4 teams existed in the top 5 positions in both tables. They are AFC Wimbledon, Bradford, Cheltenham and Northampton. That means these 4 teams were good at scoring set play goals and set play goals were more important to them. Note that Northampton and AFC Wimbledon are the only two teams scoring more set play goals than open play goals.
Throw-ins goals in League 2
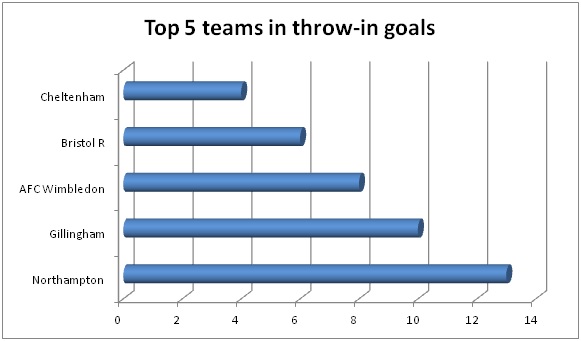
This chart shows how strong Northampton was in throw-in goals. With most of the teams having 3 throw-in goals or less, Northampton scored 13 throw-in goals this season. They scored 100% more than the 4th place Bristol Rovers having 6 throw-in goals. The great difference shows that scoring throw-in goals was a strong weapon of Northampton while most of the teams didn’t have the ability to do so.
If we consider how important throw-in goals are within set play goals, Northampton is still the team showing the highest percentage. 38.24% of their set play goals were throw-in goals. It showed how important throw-in goals were to Northampton.

In fact, Gillingham and Northampton were the only 2 teams with more than 30% of their set play goals as throw-in goals. Considering only 9 teams in the league having more than 10% of their set play goals as throw-in goals, it shows how Northampton outperformed other teams by having 38.24%.
No matter we consider the number of throw-in goals or the percentage of throw-in goals, Northampton is still the best team in the league and they obviously outperformed other teams in the league.
I don’t have the goal scoring data of Stoke City this season. However, I wonder Stoke City can achieve the two conditions of Northampton or not.
- More than 50% of goals were set play goals
- Around 40% of set play goals were throw-in goals
In part 2, the focus will be analysing the details of Northampton’s throw-in goals. It includes when they scored, how they scored, where they scored, where the assists came from, etc.
Share this:

League 2 2012/13 review: Top Scorer – Tom Pope

The top goal scorer in League 2 this season is Tom Pope, who is playing in Port Vale. He played every single game this season which means he had 46 league appearances. He scored 31 league goals. Port Vale had 87 league goals in total. Therefore, Pope has scored 35.6% of team goals. He is a tall striker with the height of 1.91m. He is 27 and will become 28 next season so he is at the peak of his career according to the analysis of optimum player age from Prozone.
How he scored?

In 31 goals, he scored 13 header goals, 9 goals by right foot and 9 goals by left foot. He is an all-round striker who can score goals through different ways. He is strongest at header goals (42%) and it is reasonable considering his height (1.91m). He is good at both feet as well because he scored considerable amount of goals through right and left foot.
Where he scored?

The above chart shows that Pope scored most of his goals in the 6-yard box (13 goals) and 6-12 yard area (13 goals). Considering 42% of his goals were header goals, it shows that he played like a target man inside the box and waited for the chances in the 12-yard area from the goal. Therefore, he is not good at long shot as he scored only 1 goal outside the penalty area.
When he scored?

The chart shows a characteristic of Pope. He was particularly strong at the 15-min period of both halves. He scored 8 goals in 16-30 mins and 61-75 mins periods. The phenomena was more obvious in the first half as he scored only 2 and 3 goals in the first 15 mins and last 15 mins in the first half.
Open play vs. Set play
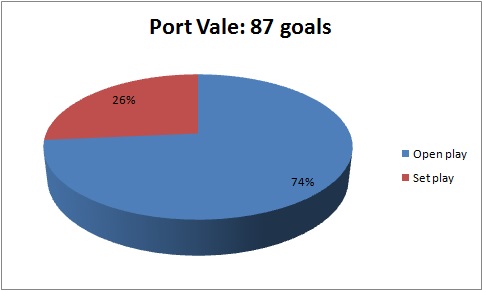
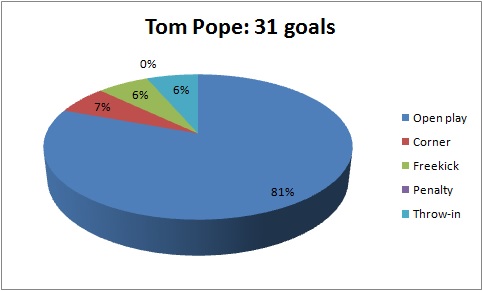
The above two charts show the comparison of the Tom Pope and the team regarding the open play and set play goals. In Port Vale team, 74% of goals were open play goals. On the other hand, 81% of Pope’s goals were open play goals. That means Pope contributed for the team more in open play goals. He hadn’t scored any penalty this season. He had only 6 goals from set play.
Where the assists came from?

The above diagrams show that most of the assists were from the flanks (67.7%), especially the left flank (48.4%). 32.3% of assists were came from the middle zones. It shows that the delivery from the flanks were more suitable for Pope to score. It fitted the previous result showing that he is strong at header. This leads to an assumption that crossing should be the main source of the assist type which will be discussed in the following chart. The reason of 48.4% of assists in the left flank could be explained by Port Vale’s strength to attack through the left flank.
Types of Assist

The previous results show that Tom Pope is stronger at header and most of the assists were came from the flanks. The above chart supports the previous findings because it shows that crossing is the main source of the assist styles (45%). The “others” assist style included dribbling and regaining possession but these were not the main source of Pope’s goal. The second main assist style was passing (26%). It was related to the following analysis about the number of touch he used to score goals.
Number of Touch

68% of Pope’s goals were scored by one touch. It fitted the previous results showing that 45% of his goals were from crossing and 26 out of 31 goals were scored within the 12-yard area from the goal. His ability to score one-touch goals is a key to his playing style as a target man working mainly near the goal. Remember he is an all-round striker who is good at scoring goals by header, right foot and left foot. It helped him a lot to score one-touch goals.
Conclusion
To conclude, here are some key statistics and findings of Tom Pope’s 31 league goals this season (2012/13):
- He is an all-round striker with 42% header goals, 29% right foot goals and 29% left foot goals
- 26 out of 31 goals were scored with 12-yard area from the goal. It fits his playing style as a target man.
- He was particularly strong at the 15-min period of both halves (i.e. 16-30 mins and 61-75 mins). 16 out of 31 goals were scored in those 30-min periods.
- He was stronger at open play (81%) than set play (19%) comparing with the stats of the Port Vale team (74% vs. 26%).
- 67.7% of the assists were from the flanks, especially left flank (48.4%)
- Crossing was the main source of the assist style (45%)
- 68% of his goals were scored by one-touch
In order to bring out the best in Tom Pope, Port Vale should provide crosses from the flanks and let Pope stay at the 12-yard area from the goal for him to score one-touch goals in the coming season.
Share this:

League 2 2012/13 review: Time Analysis
There were 1411 League 2 goals in the 2012/13 season. This article will focus on the time at which goals were scored during match play. These are important information because it shows the characteristics of different teams. I did a time analysis once in December, 2013. That result showed that there was a systematic and significant upward trend in the number of goals scored as time progressed. This time all the goals in 2012/13 season were included and the upward trend is still the same. It further supports the previous research suggesting an increase in the frequency of goals scored as a match progresses (Jinshan et al., 1993; Reilly, 1996). The methodology is the same as I divided the 90 minutes into six 15-min periods. The following chart shows when the 1411 goals were scored in League 2 this season.
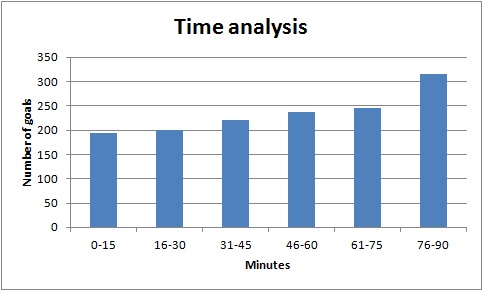
The goals scored in the last 15 minutes of the game were obviously more than other periods.
The following table shows the number of goals scored in six periods of different teams. The data were shown in a Red-Yellow-Green colour scale. That means, the higher number would be highlighted by red and the lower number would be highlighted by green for better visualisation of the data.

Gillingham, Wycombe and Bristol Rovers were the teams which started the game strongly in the first 15 minutes by scoring 14, 13 and 12 goals. Gillingham showed a special characteristic as they scored more goals in first half (39 goals) than second half (27 goals) significantly. They scored least goals in the last quarter (7 goals) which was different from the general trend of other teams which scored most goals in the last quarter. York City was another team having the same characteristic because their first half goals (31) were much more than that in second half (19).
Northampton scored most goals (19) in the last quarter but generally most of the team scored more goals in the last quarter so the difference was not significant. Port Vale showed something special as they significantly outperformed other teams in the second quarter (16-30 mins) by scoring 17 goals while most of the teams had less than 10 goals in this period.
Wycombe was a special team as well because they were particulary strong in the first 15 minutes of the halves by scoring 12 goals in 0-15 and 45-60 minutes. In other periods they scored only 6 to 7 goals.
However, if we just count the goals scored, it is not showing the whole picture of analysis because stronger teams scored more goals (e.g. Port Vale scored 87 goals and Aldershot scored 42 goals). If we want to find the characteristics of the teams, we have to convert these data into percentage which is shown by the following table.
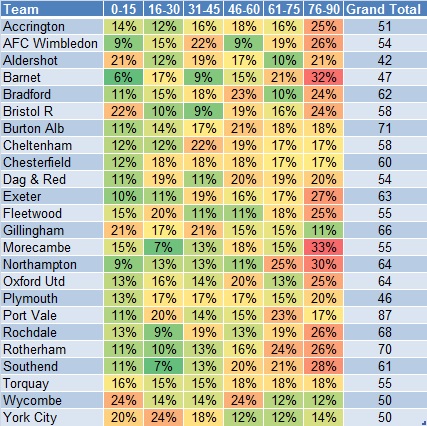
Only 5 teams scored 20% or more goals in the first 15 minutes of the game and they were Aldershot, Bristol Rovers, Gillingham, Wycombe and York City. AFC Wimbledon, Cheltenham and Gillingham were stronger in the 15 minutes before the first half break as they had 22%, 22% and 21% of goals in that period.
Barnet was the weakest team in the first 15 minutes (6%) but they were very strong in the last quarter with 32% scored within the last 15 minutes of the game. Morecambe and Northampton were the two remaining teams which had more than 30% of goals in the last quarter. If we consider the last 30 minutes of the game, the characteristics of these teams were more significant. Barnet and Northampton had 53% and 55% of goals scored in the last 30 minutes of the game and these could be important information for their opponents.
Aldershot and Bristol Rovers shared the same characteristic as they were both strong in the first and last quarters having more than 20% of total number of goals. The team with the most evenly distributed number of goals in all six quarters was Torquay. They had around 15%-18% of goals in each quarter.
To conclude, the characteristics of the teams could be shown by having the time analysis. Some teams were stronger in the first half (e.g. Gillingham and York City). Some teams were stronger in the last 30 minutes of the game (e.g. Barnet and Northampton). These information would be useful for the opposition analysis to know the strengths and weaknesses of the opponents.
Reference
Jinshan et al., 1993. Analysis of the goals in the 14th World Cup. In: J. C. a. A. S. T. Reilly, ed. Science and Football II. London: E. and F.N. Spon, pp. 203-205.
Reilly, T., 1996. Motion analysis and physiological demands. In: T. Reilly, ed. Science and Soccer. London: E. and F.N.Spon, pp. 65-81.

