Monthly Archives: June 2013
League 2 2012/13 review: Top Scorer – Tom Pope

The top goal scorer in League 2 this season is Tom Pope, who is playing in Port Vale. He played every single game this season which means he had 46 league appearances. He scored 31 league goals. Port Vale had 87 league goals in total. Therefore, Pope has scored 35.6% of team goals. He is a tall striker with the height of 1.91m. He is 27 and will become 28 next season so he is at the peak of his career according to the analysis of optimum player age from Prozone.
How he scored?

In 31 goals, he scored 13 header goals, 9 goals by right foot and 9 goals by left foot. He is an all-round striker who can score goals through different ways. He is strongest at header goals (42%) and it is reasonable considering his height (1.91m). He is good at both feet as well because he scored considerable amount of goals through right and left foot.
Where he scored?

The above chart shows that Pope scored most of his goals in the 6-yard box (13 goals) and 6-12 yard area (13 goals). Considering 42% of his goals were header goals, it shows that he played like a target man inside the box and waited for the chances in the 12-yard area from the goal. Therefore, he is not good at long shot as he scored only 1 goal outside the penalty area.
When he scored?

The chart shows a characteristic of Pope. He was particularly strong at the 15-min period of both halves. He scored 8 goals in 16-30 mins and 61-75 mins periods. The phenomena was more obvious in the first half as he scored only 2 and 3 goals in the first 15 mins and last 15 mins in the first half.
Open play vs. Set play
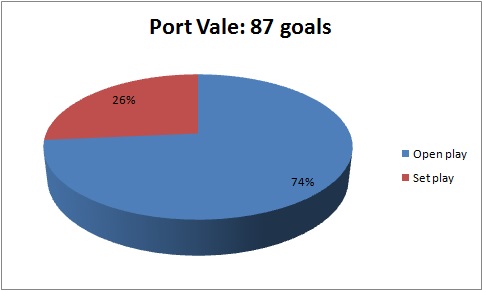
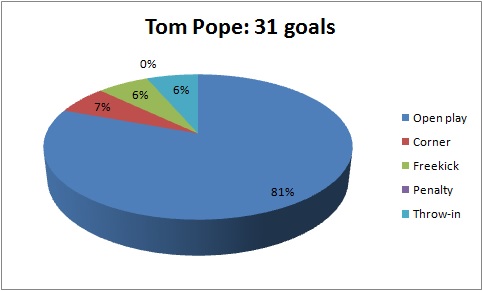
The above two charts show the comparison of the Tom Pope and the team regarding the open play and set play goals. In Port Vale team, 74% of goals were open play goals. On the other hand, 81% of Pope’s goals were open play goals. That means Pope contributed for the team more in open play goals. He hadn’t scored any penalty this season. He had only 6 goals from set play.
Where the assists came from?

The above diagrams show that most of the assists were from the flanks (67.7%), especially the left flank (48.4%). 32.3% of assists were came from the middle zones. It shows that the delivery from the flanks were more suitable for Pope to score. It fitted the previous result showing that he is strong at header. This leads to an assumption that crossing should be the main source of the assist type which will be discussed in the following chart. The reason of 48.4% of assists in the left flank could be explained by Port Vale’s strength to attack through the left flank.
Types of Assist

The previous results show that Tom Pope is stronger at header and most of the assists were came from the flanks. The above chart supports the previous findings because it shows that crossing is the main source of the assist styles (45%). The “others” assist style included dribbling and regaining possession but these were not the main source of Pope’s goal. The second main assist style was passing (26%). It was related to the following analysis about the number of touch he used to score goals.
Number of Touch

68% of Pope’s goals were scored by one touch. It fitted the previous results showing that 45% of his goals were from crossing and 26 out of 31 goals were scored within the 12-yard area from the goal. His ability to score one-touch goals is a key to his playing style as a target man working mainly near the goal. Remember he is an all-round striker who is good at scoring goals by header, right foot and left foot. It helped him a lot to score one-touch goals.
Conclusion
To conclude, here are some key statistics and findings of Tom Pope’s 31 league goals this season (2012/13):
- He is an all-round striker with 42% header goals, 29% right foot goals and 29% left foot goals
- 26 out of 31 goals were scored with 12-yard area from the goal. It fits his playing style as a target man.
- He was particularly strong at the 15-min period of both halves (i.e. 16-30 mins and 61-75 mins). 16 out of 31 goals were scored in those 30-min periods.
- He was stronger at open play (81%) than set play (19%) comparing with the stats of the Port Vale team (74% vs. 26%).
- 67.7% of the assists were from the flanks, especially left flank (48.4%)
- Crossing was the main source of the assist style (45%)
- 68% of his goals were scored by one-touch
In order to bring out the best in Tom Pope, Port Vale should provide crosses from the flanks and let Pope stay at the 12-yard area from the goal for him to score one-touch goals in the coming season.
Share this:

League 2 2012/13 review: Time Analysis
There were 1411 League 2 goals in the 2012/13 season. This article will focus on the time at which goals were scored during match play. These are important information because it shows the characteristics of different teams. I did a time analysis once in December, 2013. That result showed that there was a systematic and significant upward trend in the number of goals scored as time progressed. This time all the goals in 2012/13 season were included and the upward trend is still the same. It further supports the previous research suggesting an increase in the frequency of goals scored as a match progresses (Jinshan et al., 1993; Reilly, 1996). The methodology is the same as I divided the 90 minutes into six 15-min periods. The following chart shows when the 1411 goals were scored in League 2 this season.
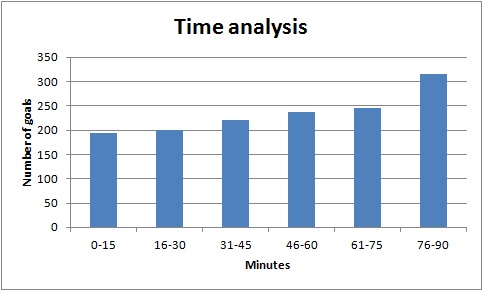
The goals scored in the last 15 minutes of the game were obviously more than other periods.
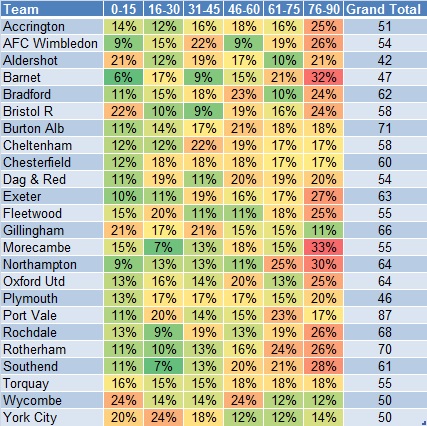
The following table shows the number of goals scored in six periods of different teams. The data were shown in a Red-Yellow-Green colour scale. That means, the higher number would be highlighted by red and the lower number would be highlighted by green for better visualisation of the data.

Gillingham, Wycombe and Bristol Rovers were the teams which started the game strongly in the first 15 minutes by scoring 14, 13 and 12 goals. Gillingham showed a special characteristic as they scored more goals in first half (39 goals) than second half (27 goals) significantly. They scored least goals in the last quarter (7 goals) which was different from the general trend of other teams which scored most goals in the last quarter. York City was another team having the same characteristic because their first half goals (31) were much more than that in second half (19).
Northampton scored most goals (19) in the last quarter but generally most of the team scored more goals in the last quarter so the difference was not significant. Port Vale showed something special as they significantly outperformed other teams in the second quarter (16-30 mins) by scoring 17 goals while most of the teams had less than 10 goals in this period.
Wycombe was a special team as well because they were particulary strong in the first 15 minutes of the halves by scoring 12 goals in 0-15 and 45-60 minutes. In other periods they scored only 6 to 7 goals.
However, if we just count the goals scored, it is not showing the whole picture of analysis because stronger teams scored more goals (e.g. Port Vale scored 87 goals and Aldershot scored 42 goals). If we want to find the characteristics of the teams, we have to convert these data into percentage which is shown by the following table.
Only 5 teams scored 20% or more goals in the first 15 minutes of the game and they were Aldershot, Bristol Rovers, Gillingham, Wycombe and York City. AFC Wimbledon, Cheltenham and Gillingham were stronger in the 15 minutes before the first half break as they had 22%, 22% and 21% of goals in that period.
Barnet was the weakest team in the first 15 minutes (6%) but they were very strong in the last quarter with 32% scored within the last 15 minutes of the game. Morecambe and Northampton were the two remaining teams which had more than 30% of goals in the last quarter. If we consider the last 30 minutes of the game, the characteristics of these teams were more significant. Barnet and Northampton had 53% and 55% of goals scored in the last 30 minutes of the game and these could be important information for their opponents.
Aldershot and Bristol Rovers shared the same characteristic as they were both strong in the first and last quarters having more than 20% of total number of goals. The team with the most evenly distributed number of goals in all six quarters was Torquay. They had around 15%-18% of goals in each quarter.
To conclude, the characteristics of the teams could be shown by having the time analysis. Some teams were stronger in the first half (e.g. Gillingham and York City). Some teams were stronger in the last 30 minutes of the game (e.g. Barnet and Northampton). These information would be useful for the opposition analysis to know the strengths and weaknesses of the opponents.
Reference
Jinshan et al., 1993. Analysis of the goals in the 14th World Cup. In: J. C. a. A. S. T. Reilly, ed. Science and Football II. London: E. and F.N. Spon, pp. 203-205.
Reilly, T., 1996. Motion analysis and physiological demands. In: T. Reilly, ed. Science and Soccer. London: E. and F.N.Spon, pp. 65-81.

