Category Archives: Wigan
Time Analysis of Championship teams
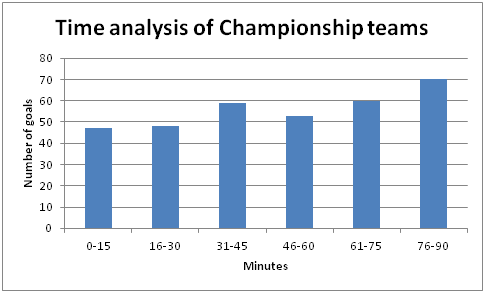
There are 337 Championship goals (updated to 17/10/2013). By analysing the time at which goals are scored during match play, the characteristics of the teams could be shown. The 90 minutes game was divided into six 15-min periods. The upward trend shown in the following chart fits the findings of researchers (Jinshan et al., 1993; Reilly, 1996) and the time analysis I did for League 2 last season. Moreover, it is worthy to note that more goals were scored before the end of halves. Therefore, there is a small upward trend in each half of the game.
The following table shows the number of goals scored in six periods of different teams. The data were shown in a Red-Yellow-Green colour scale. That means, the higher number would be highlighted by red and the lower number would be highlighted by green for better visualisation of the data.
Generally, most of the teams scored more goals in the second half which fit the general trend. However, Ipswich is an exception as they scored the most goals (5 goals) in the first 15 mins of the game. The following video shows these 5 early goals of Ipswich.
Burnley is a team showing a speical characteristic that they are strong in scoring before the end of halves. They scored 6 and 5 goals before the end of first half and full time. These number are remarkably more than the number of goals they scored in other time slots. The following video shows these 11 goals Burnley scored before the end of halves.
Watford scored the most goals (7 goals) in the last 15 mins of the game while Sheff Wed and Doncaster are the only teams which haven’t scored any late goal at the moment. There is an interesting fact that Doncaster haven’t scored any early goal in the first 15 mins of the game also.
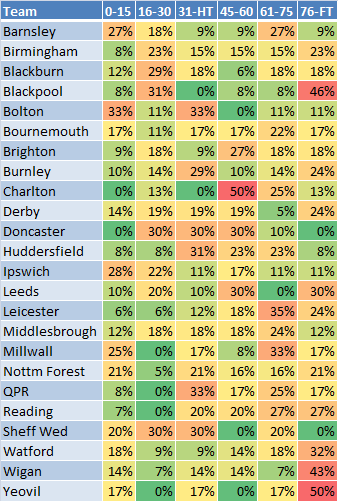
However, if we just count the goals scored, it is not showing the whole picture of analysis because stronger teams scored more goals. If we want to analyse more in depth, we have to convert these data into percentage. The following table shows the same set of data in percentage form.
Charlton has their characteristic that they are partcularly strong when they started their second half. 50% of their goals were scored in the first 15 mins of the second half. The following videos shows these 4 early goals in the second half of the game.
Blackpool, Wigan and Yeovil are the similar teams which relied heavily on the last 15 mins to score goals. These three teams had more than 40% of their goals scored in this time slot.
Blackpool is the only team having less than 10% of goals in 4 time slots. In other words, nearly 80% of their goals were scored in 16-30 mins and 76-full time. It could be a useful stats for the team playing against Blackpool to decide when to put more effort to defend. The following video shows the 6 goals (46%) Blackpool scored in the last 15 mins.
Yeovil is another extreme example. They haven’t scored any goal in 2 time slots (16-30, 45-60) but they scored 50% of their goals in the last time slot. The team playing against them should pay extra attention to the last 15 mins of the game. The following video shows the 3 goals (50%) Yeovil scored in the last 15 mins.
Reference
Jinshan et al., 1993. Analysis of the goals in the 14th World Cup. In: J. C. a. A. S. T. Reilly, ed. Science and Football II. London: E. and F.N. Spon, pp. 203-205.
Reilly, T., 1996. Motion analysis and physiological demands. In: T. Reilly, ed. Science and Soccer. London: E. and F.N.Spon, pp. 65-81.


