Category Archives: Gillingham
Northampton – Stoke City in League 2? (Part 1)
Stoke City is famous for their long throw-ins attacking strategy. It is a different kind of attack for the defenders who get used to crosses. It is also a big question for the keepers whether they should stay at the goal line or not. There are some pieces which analyse Stoke’s performance. Is there any other team having the same strategy in English football? Northampton may be the team with similar (or even better) performance in long throw-ins.
Top 5 teams in set play goals in League 2
Considering the number of set play goals, Northampton scored the most set play goals (34 goals). The following table shows the open play and set play goals of 24 League 2 teams this season and highlights the top 5 teams in set play goals. They are AFC Wimbledon, Bradford, Cheltenham, Gillingham and Northampton.

In order to analyse how important set play goals are to different teams, the percentage of set play goals were considered also. The following table shows the percentages of open play and set play goals of 24 League 2 teams this season.
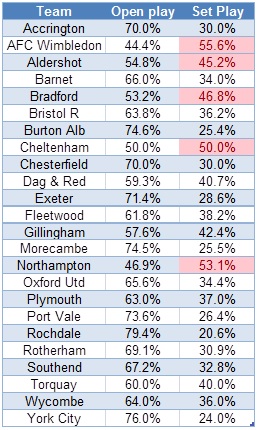
For example, being the League 2 Champion, Gillingham scored 28 set play goals but there were stronger in scoring open play goals. Therefore, set play goals only accounted for 42.4% of their total goals. The top 5 teams with the highest percentage of set play goals were AFC Wimbledon, Aldershot, Bradford, Cheltenham and Northampton. Northampton is the 2nd place in set play goal percentage. 53.1% of their goals were set play goals. Comparing both tables to each other, we can identify that 4 teams existed in the top 5 positions in both tables. They are AFC Wimbledon, Bradford, Cheltenham and Northampton. That means these 4 teams were good at scoring set play goals and set play goals were more important to them. Note that Northampton and AFC Wimbledon are the only two teams scoring more set play goals than open play goals.
Throw-ins goals in League 2
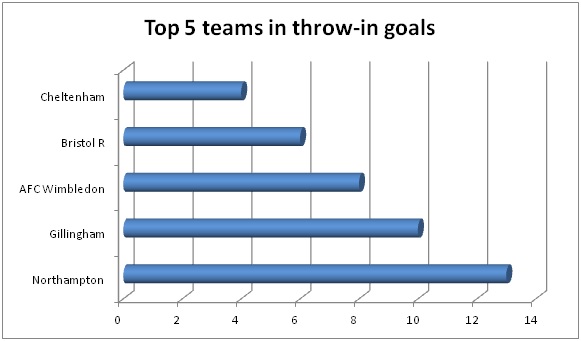
This chart shows how strong Northampton was in throw-in goals. With most of the teams having 3 throw-in goals or less, Northampton scored 13 throw-in goals this season. They scored 100% more than the 4th place Bristol Rovers having 6 throw-in goals. The great difference shows that scoring throw-in goals was a strong weapon of Northampton while most of the teams didn’t have the ability to do so.
If we consider how important throw-in goals are within set play goals, Northampton is still the team showing the highest percentage. 38.24% of their set play goals were throw-in goals. It showed how important throw-in goals were to Northampton.

In fact, Gillingham and Northampton were the only 2 teams with more than 30% of their set play goals as throw-in goals. Considering only 9 teams in the league having more than 10% of their set play goals as throw-in goals, it shows how Northampton outperformed other teams by having 38.24%.
No matter we consider the number of throw-in goals or the percentage of throw-in goals, Northampton is still the best team in the league and they obviously outperformed other teams in the league.
I don’t have the goal scoring data of Stoke City this season. However, I wonder Stoke City can achieve the two conditions of Northampton or not.
- More than 50% of goals were set play goals
- Around 40% of set play goals were throw-in goals
In part 2, the focus will be analysing the details of Northampton’s throw-in goals. It includes when they scored, how they scored, where they scored, where the assists came from, etc.
Share this:

League 2 2012/13 review: Time Analysis
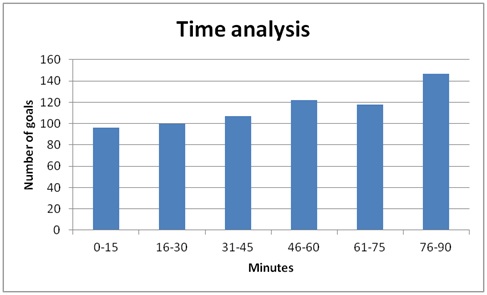
There were 1411 League 2 goals in the 2012/13 season. This article will focus on the time at which goals were scored during match play. These are important information because it shows the characteristics of different teams. I did a time analysis once in December, 2013. That result showed that there was a systematic and significant upward trend in the number of goals scored as time progressed. This time all the goals in 2012/13 season were included and the upward trend is still the same. It further supports the previous research suggesting an increase in the frequency of goals scored as a match progresses (Jinshan et al., 1993; Reilly, 1996). The methodology is the same as I divided the 90 minutes into six 15-min periods. The following chart shows when the 1411 goals were scored in League 2 this season.
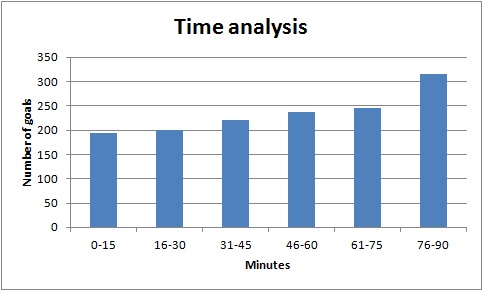
The goals scored in the last 15 minutes of the game were obviously more than other periods.
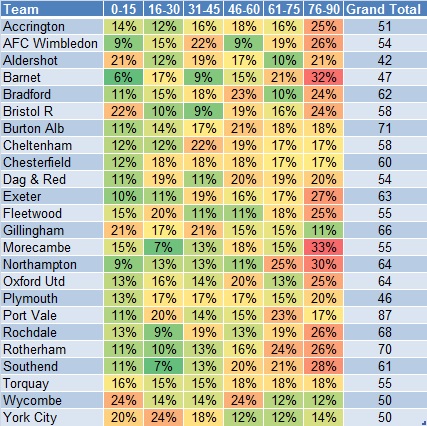
The following table shows the number of goals scored in six periods of different teams. The data were shown in a Red-Yellow-Green colour scale. That means, the higher number would be highlighted by red and the lower number would be highlighted by green for better visualisation of the data.

Gillingham, Wycombe and Bristol Rovers were the teams which started the game strongly in the first 15 minutes by scoring 14, 13 and 12 goals. Gillingham showed a special characteristic as they scored more goals in first half (39 goals) than second half (27 goals) significantly. They scored least goals in the last quarter (7 goals) which was different from the general trend of other teams which scored most goals in the last quarter. York City was another team having the same characteristic because their first half goals (31) were much more than that in second half (19).
Northampton scored most goals (19) in the last quarter but generally most of the team scored more goals in the last quarter so the difference was not significant. Port Vale showed something special as they significantly outperformed other teams in the second quarter (16-30 mins) by scoring 17 goals while most of the teams had less than 10 goals in this period.
Wycombe was a special team as well because they were particulary strong in the first 15 minutes of the halves by scoring 12 goals in 0-15 and 45-60 minutes. In other periods they scored only 6 to 7 goals.
However, if we just count the goals scored, it is not showing the whole picture of analysis because stronger teams scored more goals (e.g. Port Vale scored 87 goals and Aldershot scored 42 goals). If we want to find the characteristics of the teams, we have to convert these data into percentage which is shown by the following table.
Only 5 teams scored 20% or more goals in the first 15 minutes of the game and they were Aldershot, Bristol Rovers, Gillingham, Wycombe and York City. AFC Wimbledon, Cheltenham and Gillingham were stronger in the 15 minutes before the first half break as they had 22%, 22% and 21% of goals in that period.
Barnet was the weakest team in the first 15 minutes (6%) but they were very strong in the last quarter with 32% scored within the last 15 minutes of the game. Morecambe and Northampton were the two remaining teams which had more than 30% of goals in the last quarter. If we consider the last 30 minutes of the game, the characteristics of these teams were more significant. Barnet and Northampton had 53% and 55% of goals scored in the last 30 minutes of the game and these could be important information for their opponents.
Aldershot and Bristol Rovers shared the same characteristic as they were both strong in the first and last quarters having more than 20% of total number of goals. The team with the most evenly distributed number of goals in all six quarters was Torquay. They had around 15%-18% of goals in each quarter.
To conclude, the characteristics of the teams could be shown by having the time analysis. Some teams were stronger in the first half (e.g. Gillingham and York City). Some teams were stronger in the last 30 minutes of the game (e.g. Barnet and Northampton). These information would be useful for the opposition analysis to know the strengths and weaknesses of the opponents.
Reference
Jinshan et al., 1993. Analysis of the goals in the 14th World Cup. In: J. C. a. A. S. T. Reilly, ed. Science and Football II. London: E. and F.N. Spon, pp. 203-205.
Reilly, T., 1996. Motion analysis and physiological demands. In: T. Reilly, ed. Science and Soccer. London: E. and F.N.Spon, pp. 65-81.
Share this:

Clean Sheets Analysis of League 2
A football game is all about attacking and defending. Therefore, keeping a clean sheet is as important as scoring goals. A team scoring a goal doesn’t guarantee any point but keeping a clean sheet guarantee at least one point and potentially getting three points. In this post, the defensive performance of League 2 teams would be discussed by analysing the clean sheets of League 2. Updated to January 28, there were 338 matches had been played, that means there were 676 team performances. Of these 676 team performances, 189 ended up with a clean sheet (28%). The teams produced 7.88 clean sheets on average. In these 7.88 clean sheets, 5.38 clean sheets led to wins and 2.50 clean sheets led to draws. On the other hand, clean sheets produced about 2.35 points per team and match on average.
The frequency of clean sheets is shown in the following chart.
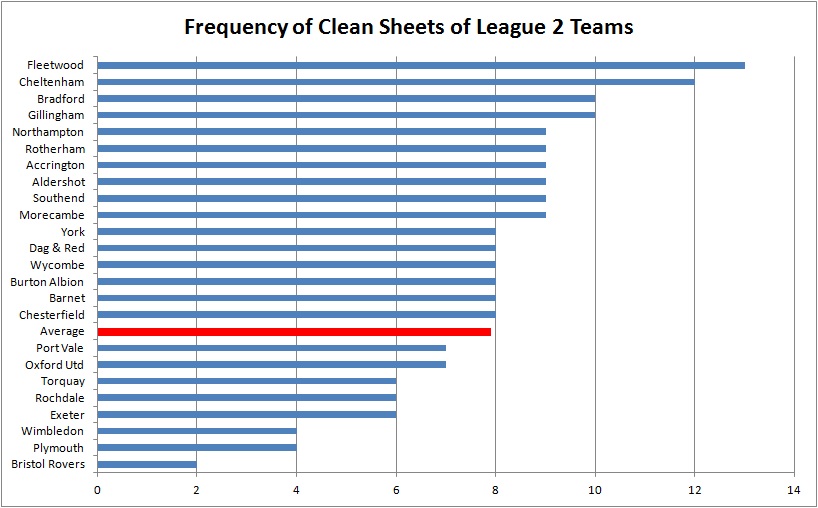
As shown in the chart, there is a huge range in abilities to keep clean sheets (from 2 to 13). Fleetwood and Cheltenham performed much better than other team, producing 13 and 12 clean sheets. Part of their ability to generate points has been their ability to produce good defence. In the top 4 clean sheet producers (10 teams), only Accrington, Morecambe and Aldershot are in the bottom half of the table. It indicates two results. Firstly, good at keeping clean sheets can lead to good league positions. Secondly, it suggests that defence is not the main issue of the above 3 teams. In order to improve their league positions, they should focus on improving their attacking. Moreover, the bottom 2 clean sheet producers are Bristol Rover, Plymouth and Wimbledon. They are the bottom 3 teams in the League 2 table as well which indicates the importance of keeping clean sheet. On the other hand, it shows how strong Port Vale’s goal scoring was. Port Vale only produced 7 clean sheets which are below average. However, they are at the top of the table which means the high number of goal scored can overcome the weakness of their defence.
Clean sheets were of different value for different teams. This is shown in the following chart.

Clean sheets had enormous value (3 points) for Exeter and Wimbledon. For every single match they held clean sheet, they won the game and got 3 points. Note that Wimbledon is at the bottom of the league table. That means the biggest problem of Wimbledon right now is the defence, not attack. On the other hand, Plymouth had the worst performance in the above chart. It shows that even Plymouth had kept clean sheet, they only managed to 1.5 points on average. Considering both charts, it means that Plymouth is having problems in both attack and defence. In the top 5 teams in this chart, 4 of them are in the top 6 of the league table. In other words, it’s not only keeping clean sheets that’s important, but also how the team managed to get points from clean sheets.
By combining both charts together, the teams can be analysed from another perspective which is shown in the following diagram.

In this chart, the two axes are the two average numbers (2.35 points gained and 7.88 frequencies of clean sheets). The objective of using two average numbers as the axes is to divide 24 teams into four quadrants showing different abilities. Firstly, Bristol Rovers, Plymouth, Torquay and Rochdale are at the bottom left corner. The characteristic of the teams in this quadrant is that they are both weak at producing clean sheets and getting points from clean sheets. The opposite quadrant is the top right quadrant which means the teams were good at producing clean sheets and got points from clean sheets as well. Gillingham was the best performer in this quadrant which means Gillingham had a good balance of attack and defence. On the other hand, the top two performers of keeping clean sheets were in the bottom right quadrant, they should focus on improving their attacking because it was the main issue hindering both teams from getting points from clean sheets. The same argument could be applied to Aldershot and Morecambe as well since they are at the bottom half of the league table. Port Vale didn’t show why they can be the top of league table in this chart because they were weak in producing clean sheets. However, their efficiency is better than Gillingham by getting more points per clean sheet game.
To conclude, keeping clean sheets is a strong indicator of a team’s defending ability. However, it’s not only keeping clean sheets that’s important, but also how the team managed to get points from clean sheets. Therefore, by dividing 24 teams into four quadrants showing different characteristics, we can understand why some teams are doing better than others and which aspects (attacking or defending) should be the main focus point for team improvement.
Share this:

Time Analysis of League 2 teams
There are 690 league 2 goals (updated to 13/12/2012). There are many perspectives of analysis of goal scoring. This article will focus on the time at which goals are scored during match play. The analysis would be useful for coaches because the relationship between goal scoring and time would appear to be linked to physical conditioning and characteristics of different teams.
I divided the 90 minutes into six 15-min periods. The following chart shows that there is a systematic and significant upward trend in the number of goals scored as time progressed. This is a support to previous research suggesting an increase in the frequency of goals scored as a match progresses (Jinshan et al., 1993; Reilly, 1996).
Then we move on from the genearl perspective to the team perspective to analyse the goals. The following table shows the number of goals scored in six periods of different teams. The data were shown in a Red-Yellow-Green colour scale. That means, the higher number would be highlighted by red and the lower number would be highlighted by green for better visualisation of the data.

Generally, most of the teams scored more goals in the second half which fit the general trend. However, Aldershot is an exception as they scored the least goals in the last 30-min period among League 2. On the other hand, Fleetwood is expertised in scoring late goal in the last 15-min period. The 12 goals they scored is remarkably higher than the goals they scored in other periods. Northampton and Port Vale are strong in the last 30-min period as well.
However, if we just count the goals scored, it is not showing the whole picture of analysis because stronger teams scored more goals. If we want to find the characteristics of the teams, we have to convert these data into percentage. For example, in the first 15-min of the game, Bristol Rovers scored 7 goals, same as Oxford United but less than Gillingham. A different table will show you a different picture. The following table shows the same set of data in percentage form.

Bristol Rovers become the best team to score early goals which is obviously a characteristic of this team. Even Gillingham scored the most goals in this period, it is only 21% of their total number of goals. This percentage is less than Oxford United and Wycombe.
The result of Fleetwood becomes more obvious. It seems that they tried to save energy in the 46-75 minutes by scoring only 11% of goals and then dominate the final 15 minutes in scoring 43% of their total goals.
Wycombe shows the same trend in both halves that they scored most of their goals in the first 30 minutes. They are particularly weak in the last 15 minutes of the half. The possible explanation is the deterioration in physical condition of players is more serious in Wycombe. Accrington, Bradford and Southend have a similar characteristic because they all scored less than 20% of their goals in the first 30 minutes of the game. It would be a good strategy to start attacking early when other teams play against these three teams.
Reference
Jinshan et al., 1993. Analysis of the goals in the 14th World Cup. In: J. C. a. A. S. T. Reilly, ed. Science and Football II. London: E. and F.N. Spon, pp. 203-205.
Reilly, T., 1996. Motion analysis and physiological demands. In: T. Reilly, ed. Science and Soccer. London: E. and F.N.Spon, pp. 65-81.
Share this:

League 2: How do teams score the first goal?
Last time, I wrote about the importance of the first goal (here). We know how important the first goal is, so the next question is “How can we score it?” Therefore, we will look at how the league 2 teams score their first goals. If you search in the internet, it is not difficult to find some findings about the general goal statistics. However, most of the goals were scored in different backgrounds and situations. Only the first goals are scored under the same circumstances: 0 – 0. Therefore, I think it is meaningful to look at the first goal statistics because it reflects the ability of teams to break the 0 – 0 situation. Please note that all the data of goals and league positions were updated to 22/10/2012.
All First Goals
The following chart shows how the teams scored all their first goals:

The goals were divided into five categories: open play, corner, free kick, penalty and throw-in. Here are the key findings:
- At least 50% of first goals were scored in open play in most teams except Aldershot, Bradford and Gillingham. Only 20% of first goals of Bradford were came from open play.
- Gillingham, which is leading the league, shows how strong they are in this chart. Not only they scored more first goals than the rest of the league, the more important point is they showed that they can score first goal in different ways (the only team which scored first goals in all five categories). They get both quantity and variety of first goals.
- Cheltenham is the second best. They scored 9 first goals in four categories.
- AFC Wimbledon, Bristol Rovers and York City scored all their first goals in open play. If you are play against them, it may be a good idea to be more aggressive in tackling to interrupt their open play because they are weak at scoring the first goal in set piece.
- If we look at the best 4 teams in this chart (Gillingham, Cheltenham, Chesterfield and Rochdale). Their league positions are 1st, 4th, 13th and 8th. I argue that strong at scoring first goal will bring teams to the top half of the table. However, it also depends on how good the team can retain their winning position. This topic was discussed last time.
Open Play First Goals
Then we focus on the open play goals first. The following chart shows how the teams scored the first goals in open play.

The goals were divided into four categories: right foot, left foot, header and other. Here are the key findings:
- Aldershot and Bradford are struggling in scoring open play first goal by scoring just once. However, it is worthy to note that Aldershot is in 23th and Bradford City is in 5th position.
- Barnet and Southend are the second worst by scoring 2 open play first goals. Barnet is in 24th and Southend is in 11th position. I argue that weak at scoring open play first goal will bring the teams to bottom zone but it is interesting to find out what Bradford and Southend did to bring them a decent league position.
- AFC Wimbledon and York City scored the most open play first goal by left foot.
- If we look at the best 5 teams in this chart (Chesterfield, York City, Fleetwood, Morecambe and Port Vale). Their positions are 13th, 12th, 3nd, 14th and 2nd). Only 2 out of 5 teams are in the first 7 positions which is playoff zone. I argue that strong at scoring open play first goal will bring the team to a mid table position at least but not enough to be the top 7 positions.
- Only 8 teams had scored open play first goals by header. 6 out of 8 teams are in the top half of the table. Gillingham and Fleetwood are the best and they are in the top 3 position in the league table. I argue that there is a relationship between them.
Set Piece First Goals
The following chart shows how the teams scored the first goals in set piece.

The goals were divided into four categories: right foot, left foot, header and penalty. Here are the key findings:
- Most of the teams scored 1 or 2 set piece first goal.
- Gillingham is overwhelming in this chart, performing much better than the rest of the league. Interestingly, there is no header and left foot goal within those 7 goals. Scoring set piece first goal is a strong weapon of Gillingham to be the leader of the league.
- Bradford is the strongest team in scoring by headers in set piece first goal.
- If we look at the best 4 teams in this chart (Gillingham, Bradford, Cheltenham and Rochdale). Their league positions are 1st, 5th, 4nd and 8nd). All of them are in top half of the table. 3 out of 4 teams are in the top 7 positions which is playoff zone. I argue that strong at scoring set piece first goal will bring the team to the top 7 positions.
Conclusions:
- At least 50% of first goals were scored in open play in most teams except Aldershot, Bradford and Gillingham
- Gillingham and Cheltenham can score first goals through different ways and they are the two best team of scoring first goal
- Strong at scoring first goal will bring teams to the top half of the table
- AFC Wimbledon and York City scored the most open play first goal by left foot
- Only 8 teams had scored open play first goals by header. 6 out of 8 teams are in the top half of the table
- Weak at scoring open play first goal will bring the teams to bottom zone. Aldershot and Barnet are the examples
- Most of the teams scored 1 or 2 set piece first goal
- Gillingham is overwhelming in scoring set piece first goal
- Bradford is the strongest team in scoring by headers in set piece first goal
- Strong at scoring set piece first goal will bring the team to the top 7 positions
Scoring first goal is not everything, it is also important to retain the winning position which was discussed in the last article (here).
Share this:

England League 2: How important is the first goal?
Performance analysis is usually thought as an elite tool which is for big clubs and high level leagues only because big clubs have the resources to afford analysis software and different IT technological support. In my opinion, it should not be the case. Performance analysis is a process which can be done by small football clubs also. Small clubs don’t have the big budget to do as much as the big clubs do but we are going through the same process. That’s why I would like to share my experience and work of doing performance analysis in a League 2 club.
No doubt, everybody knows the first goal is important. However, do they know how important it is? How to transfer the concept of “importance” to a quantified stuff, such as points? Different leagues have different levels; we can’t apply all the findings in Premier League to League 2 as there are so many differences such as playing styles, distance covered, etc. I would quantify the concept of “importance” by making statistics about the points got at the end of the game by a team when they scored or conceded the first goal. I would call it as “expected points” which means the points a team expected to get from the first goal. I would use different perspectives to analyse the first goal in league 2:
- Time of goal
- Match location (Home or Away)
- League position (In groups)
- Team
Average
I used the first 8 league games in each team, which means 95 games in total (the game between Wycombe and Bristol Rovers on 25/8 was excluded as it was abandoned 66 minutes). Among these 95 games, 86 games had goal(s). The following chart shows that the expected points of scoring first and conceding first are 2.30 and 0.49 in average. These would be used as a reference for other results found by using different perspectives.

Time of Goal
Time is an important factor of first goal. I divide 90 minutes into 6 categories, which mean 15 minutes per category.

Teams got most expected points (3 points) when they scored the first goal in 76-90 minutes. It is reasonable as there is not much time for the opponent to fight back. However, there were only 2 goals scored in this timeslot which makes this finding not so persuasive since the sample size is not big enough. I’d rather to ignore this timeslot. Teams could get high expected points if they score the first goal between 16 to 45 minutes, 30 minutes timeslot before the interval. Since the expected points drops after 45 minutes, the first goal scored within 30 minutes before half time are more valuable than first goal scored 30 minutes after half time. I heard argument that scoring before the interval is a great advantage but statistics in this chart showing that the expected points from 16-30 minutes and 31-45 minutes are similar. However, a similar argument may be right. Scoring before the interval is particularly damaging to the opposition. As you can see from the chart, teams conceding first goal just before half time could only get 0.29 expected points which is obviously less than conceding first goal in other timeslots which fits the argument. Nobody would like to concede an early goal but statistics show that the team don’t have to be pessimistic even they do concede an early goal within 1-15 minutes. Teams can get 0.64 expected points which is the highest comparing with other timeslots. This can be explained that the team still have much time to bounce back.
Location

From the above chart, teams scoring the first goal in home were more likely to keep the winning positions and get more points than scoring first in away game. It may be explained by home advantage that teams play better in home. However, the same argument can’t be applied in conceding first because they both got 0.49 expected points. Home advantage may help the team more to keep winning position but not bouncing back from behind.
League Position

Note that the league positions are updated to 1/10. In scoring first (blue columns), an obvious downward trend can be seen which shows that stronger teams were more likely to retain their winning position when scoring first. There is a big gap difference (0.51 expected points) between positions 1-6 and positions 7-12. Another big gap difference (0.49 expected points) appears in between positions 7-12 and positions 13-18. However, there is not much difference (0.11 expected points) between positions 13-18 and positions 19-24. I would say in terms of the ability to retain winning position after scoring first, there are 3 levels in league 2. Positions 13-24 would be at more or less the same level. Positions 7-12 are much better than the bottom half of the table but positions 1-6 are much better than positions 7-12 as well.
The downward trend can’t be seen in considering the conceding first (red columns). Positions 13-18 got a better result than positions 7-12, similar to positions 1-6. In fact, it surprises me a little bit as I expected the downward trend in conceding first same as scoring first. We would look at individual teams afterwards to see what we can find. However, the expected points from positions 19-24 (0.16 points) are obviously less than other groups. It shows that they struggle to bounce back if they concede the first goal.
Team

The tables are listed according to the league position (updated to 1/10). The above table is about scoring first. The first 8 teams in the league table all scored first goals for at least 4 times. Among these 8 teams, 4 of them get expected points of 3 which means that whey they scored first, they kept the winning position and won the game every time. Gillingham scored first goal in 7 out of 8 games which is a brilliant result. Moreover, they retained and won all those 7 games which make them the best in league 2. Rochdale performed very well since they scored first goal 6 times, which is the second best. However, their weakness is to retain the winning position because they can only get 1.8 expected points, which is the worst in the top half of the table. Plymouth scored first goal twice but they get only 0.5 expected points per game which means they couldn’t won a game even they scored first. This result is the worst in the league. We would look at the conceding first in the following table.

Although Plymouth is the worst team in retaining winning position, they are the strongest team in the league 2 to bounce back from conceding first. They conceded first goal four times, but they bounced back and won the game twice so they got 1.5 expected points per game, which is 50% better than a draw. This is the best result in the league 2. Exeter and Torquay are the second best teams, getting 1.3 expected points. It is worthy to note that Torquay and Plymouth are at the 15th and 16th of the table, but they are the two best team to bounce back from conceding first. This can explain why in the league position chart positions 13-18 performs surprisingly better than expected.
Conclusion:
- Scoring in 16-30, 31-45 minutes (30 minutes before half time) can get higher expected points
- Conceding 15 minutes before half time would be the worst time to concede the first goal
- Playing in home is more likely to retain the winning position
- In terms of bouncing back, there is no difference in playing home and away games
- The 12 teams in the top half of league table are much better in retaining winning position than the bottom half of the table. Among those 12 teams in the top half of table, the first 6 teams are significantly better than positions 7-12 teams.
- Positions 19-24 teams are obviously weak in bouncing back when conceding first
- Gillingham is the strongest team to score first and retain the winning position
- Rochdale is strong in scoring first but weak at retaining the winning position to the end of the game
- Plymouth is a special team. They are the worst team in scoring first and get only 0.5 expected points. However, they are the strongest team in bouncing back from conceding first, getting 1.5 expected points.
This is my first analysis article about league 2. I will write at least a few more articles about league 2 this season.

