What is “Zone 14” in football?
Through the introduction of football performance analysis, football games has been analysed in many ways. Zone 14 was classified as the “golden square” in the pitch which helps teams score more goals. It was supported by evidences showing that successful teams had a better performance in zone 14. In this post, the two examples used would be France (1998-2000) and Manchester United (1998-1999).
Where is Zone 14?
By dividing the field into a six-by-three grid, there are 18 zones on the pitch. Zone 14 is the zone located in the middle of the pitch immediately outside the penalty area appears crucial for goal scoring (Taylor et al., 2002). It is shown in the following diagram.
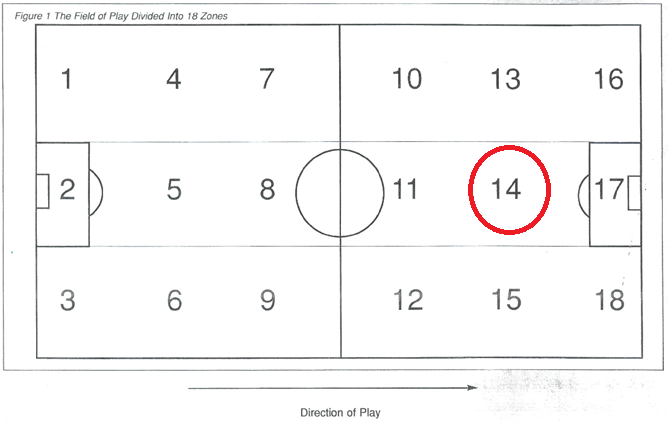
The location of Zone 14 (Grant et al., 1998)
Why is Zone 14 so important?
It is one of the key factors to differentiate the successful and unsuccessful teams (Grant et al., 1998). Other researchers had the same result showing that successful teams attack through the centre of the field more effectively than less successful teams (Grant, 2000; Horn and Williams, 2002).
Generally, there are 4 key points that successful teams were found to play in Zone 14:
- More passes to all zones to the side and ahead of zone 14 (Horn et al., 2002)
- More forward passes from and within zone 14 (Horn et al., 2002)
- To make more passes in zone 14 compared with unsuccessful teams (Grant et al., 1998)
- To generate attempts on goal from possession regained in zone 14 (Horn et al., 2002)
The first example is France national team (1998-2000). In July 2000, France became the first nation to win the European Championship (2000) as World Champions (1998).
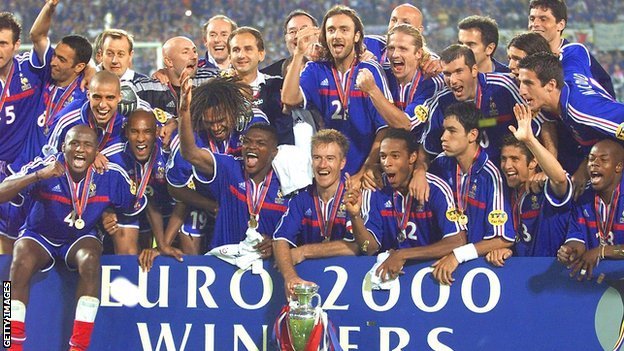
France National Team in Euro 2000 (BBC Sport, 2012)
It was found that 81.3% of their assists in two competitions came from the central area (Horn et al., 2000). In other words, France’s attacking play was narrow. Another finding showed that the majority of France’s attempt at goal came from assists in central attacking area just outside the penalty area (Horn et al., 2000).
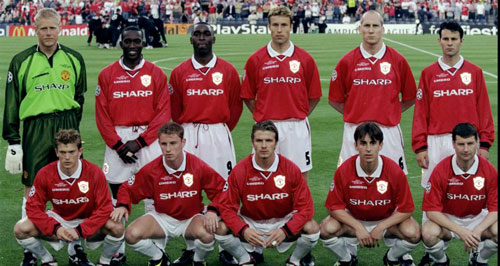
The second example is Manchester United FC (1998-99), which was the first English side to win Premiership, F.A. Cup and European Champions League in the same season.

Manchester United 1999 (Sawh, 2010)
Grant and Williams (1999) did a research on this team and found that passing was the most common form of assist. Moreover, the majority of passing assists came from central attacking area.
What is Zone 14?
The above findings gave a brief idea what zone 14 is. Different researches have their own view but generally their opinions were very similar. Grant et al. (1998) argued that Zone 14 is the attacking midfielder area which is the crucial area for producing successful attack. Horn et al. (2000) and Taylor et al. (2002) both argued that Zone 14 is the key area which produces vast majority of passing assist. Grant and Williams (1999) did not mention zone 14 but they found that passing is the most common form of assist and the majority of passing assists came from central attacking area. In fact, some coaches know the importance of this zone but they refer it by using another name “The Hole”. However, from the perspective of performance analysis, the researchers had brought forward the understanding of how it works (Telegraph, 2002), which is shown in the following paragraph.
How to use Zone 14 effectively?
Effective use of Zone 14 must be combined with positive, forward passing and tight possession from the back of the field (Telegraph, 2002). The keywords are “positive, forward passing” which lead to the next question “where the ball should be passed?” According to the Horn et al. (2002), teams were more than 4 times more likely to score goals by playing directly into the penalty area than playing laterally to the wings. In other words, fewer goals would be scored through possession leaving zone 14 to the wide areas. Possession time is another reason why the ball leaving zone 14 should be passed into the penalty area directly. Horn et al. (2002) found that the ball was kept in zone 14 for 2.7 seconds in average in order to score a goal. If the possession lasts over 8 seconds, then it won’t produce an attempt on goal. That means quick attack is a key point in using zone 14. No doubt, moving the ball laterally rather than forward into the penalty area is likely to introduce more passes and longer time in possession, then the threat of zone 14 would be neutralised.
Who is Zone 14 for?
The zone 14 is effective only when exploited by a skilful player who can quickly change the direction of attack with a short pass or twisting run lasting no more than 8 seconds (Horn et al., 2002). Therefore, the players with the ability to play in zone 14 are highly technical. They should be the players that were regarded as the most exciting to watch. Grant et al. (1998) mentioned Zidane and Bergkamp as examples.

Zinedine Zidane (Rascojet, 2011)
Here is an example showing Zidane’s play in Zone 14:

Dennis Bergkamp (The FA, 2013)
Here is an example showing Bergkamp’s play in Zone 14:
Balance
Although Zone 14 is so important in attacking, it doesn’t mean that teams should not make crossing from both flanks. Crossing is a very effective way to produce goals also. In fact, Grant (2000) found that successful teams are effective at using crosses to score goals. The key point is that teams should avoid using zone 14 to attack wide areas, which is proved in previous findings. Instead of using short wide passes from zone 14, teams should switch the ball across the whole field, or move the ball forward all the way down one side to attack flanks and make crossing (Horn et al., 2002). In the example of Manchester United (1998-99), it was found that the team was able to make flank attack and have the ability to penetrate through central attacking area (Grant and Williams, 1999). In the France team (1998-2000), their attacking play was very narrow so there were not many crossing assists.
Conclusion
Zone 14 is located outside the penalty area. It is a factor to differentiate successful and unsuccessful teams because it provides most assist. The most effective way to use zone 14 is to make a forward passing into the penalty area. Moreover, the attacking play should be quick. The possession in zone 14 should not be more than 8 seconds. The importance of flanks attack should not be ignored because a successful team should be able to make both attacking styles.
In my opinion, the best way is to attack through zone 14 first as it is more effective. If they can’t penetrate through the central attacking area, then they attack the wide areas.
References
BBC Sport, 2012. Euro 2000: The French Revolution [digital image] [viewed 17 August 2013]. Available from: http://news.bbcimg.co.uk/media/images/60195000/jpg/_60195604_81575581.jpg
GRANT, A. & WILLIAMS, M., 1999. Analysis of the Final 20 matches played by Manchester United in the 1998-99 season. Insight, 1(3), 42-44
GRANT, A., 2000. Ten Key Characteristics of Successful Team Performance. Insight, 3(4), 26-27
GRANT, A., T. REILLY, M. WILLIAMS & A. BORRIE, 1998b. Analysis of the Successful and Unsuccessful Teams in the 1998 World Cup. Insight, 2(1), 21-23
HORN, R. & M. WILLIAMS, 2002. A Look Ahead to World Cup 2002: What Do the Last 40 Years Tell Us? Insight, 5(2), 26-29
HORN, R., M. WILLIAMS & A. GRANT, 2000. Analysis of France in World Cup 1998 and Euro 2000. Insight, 4, 40-43
HORN, R., WILLIAMS, M., & ENSUM, J., 2002. Attacking in Central Areas: A Preliminary Analysis of Attacking Play in the 2001/2002 F.A. Premiership Season. Insight, 5(3), 31-34
Rascojet, 2011. Zidane [digital image] [viewed 17 August 2013]. Available from: http://www.rascojet.com/blog/wp-content/uploads/2011/01/Zidane.jpg
Sawh, M., 2010. manchester_united_1999 [digital image] [viewed 17 August 2013]. Available from: http://sackthemanager.files.wordpress.com/2012/01/manchester_united_1999_cham.jpg
TAYLOR, S., J. ENSUM & M. WILLIAMS, 2002. A Quantitative Analysis of Goals Scored. Insight, 5(4), 28-31
The FA, 2013. dennis-bergkamp-testimonial [digital image][viewed 17 August 2013]. Available from: http://www.thefa.com/~/media/Images/TheFAPortal/News%20Articles/2013/dennis-bergkamp-testimonial.ashx?w=620&h=349&c=facupgallery&as=1
THE TELEGRAPH, 2002. Scientists find football’s golden square [online]. Available from: http://www.telegraph.co.uk/sport/football/3028353/Scientists-find-footballs-golden-square.html
Share this:

‘Why foreign players migrate and the effect their involvement has had on English football since the inception of the Premier League’ (Part 3)
In parts 3, 3a and 3b of this blog we come to analysing the major different views and perceptions on the issue: the three that frequently appear include the notions that foreign players are having a seriously detrimental effect on the production, development, and opportunities available to indigenous talent: which is therefore having a negative effect on the performance and development of the national side (Maguire & Pearton, 2000). Finally, the migratory patterns that resonate towards the core of football have heralded a process of systematic ‘deskilling’ of ‘donor’ clubs, leagues, and nations such as Africa. These sentiments are strongly held in England, but are also echoed in other countries such as Italy, as former Italian U21 coach Cesare Maldini (2000) states:
“At youth level, our football is getting worse. We don’t have the players any more. The increasing number of foreigners in our game means the opportunities for the youngsters are vanishing”
However, if we refer to recent research therein lays a controversial alternative story for the former arguments. Solberg and Haugen’s (2008) research offers a useful insight behind the phenomenon of foreign player migration in football. The authors conclude in their research that despite the view point of the common English football fan and some senior figures in world football the migration of foreign players is actually having a beneficial effect on the development of indigenous players as opposed to a detrimental effect. Further advocates of this theory (Akindes et al., (2007) provide us with evidence that when African players migrate to Europe they gain further knowledge and ‘European’ football traits, thus developing them as players and individuals.

Although, this is also a two-way process whereby at the foreign players exchange their knowledge and ‘African’ footballing traits with the indigenous players, which creates a positive learning environment for both parties. Furthermore, Elliott and Weedon (2010) support these conclusions with their own branch of research, which concerned itself with players from the English Premier Academy League. Their evidence provided additional reinforcement for Solberg and Haugen’s findings and delivers a strong basis to argue that a process of ‘feet-exchange’ rather than ‘feet-drain’ – a term which is derived from the ‘brain-drain’ early work in the 1960’s which examined the issues that ‘donor’ nations face when a highly skilled workforce migrate or relocates (Iredale & Appleyard, 2001) – is actually occurring within the Premier Academy level.

‘Feet-exchange’ is a two-way process whereby foreign and indigenous players exchange their skills, technique and knowledge, and it offers a strong counter argument against the common views and negative perspectives, at least within the Premier Academy League level. In England the game is known for its pace and physicality (Elliott & Weedon, 2010), however, English players are seen as technically inferior to their European counterparts. Within Elliott and Weedon’s paper they include their qualitative based evidence in the form of interviews with various academy coaches and managers from the across the English Premier Academy clubs. One academy manager states that in his opinion:
“[Foreign players] are far more technically oriented . . . Technique is so important, it’s the great English drawback. Physically we’re good, tactically we’re okay, but technically we’re poor. The Dutch and the Italians totally leave us standing. The [foreign] boys we’ve got, their technique is really, really good, and there’s the challenge for the English boys, they’ve learnt that they have to work on their technique.” (Anon, 2010).

As previously mentioned, the English game is known for its pace and physicality, and herein lies the two-way process of ‘feet-exchange’: as foreign players must adapt and learn to deal with the physicality and pace of the English game – with the aid and exchange of knowledge, sometimes achieved purely through the observation of the indigenous players – and therefore the indigenous players also learn to hone and improve their technical skills by playing with far superior technical players (Elliott & Weedon, 2010). This transfer of skills is concluded by an academy coach in Elliott & Weedon’s paper, who states that foreign players ‘raise the bar’ for the indigenous players. Taylor (2007) further adds that:
“[Foreign players] brought in training [philosophies] and lifestyle ideas that are ahead of our own. They have broken down prejudice and national stereotypes. As a group, they have set standards of attitude and behaviour that have been as good for our society as they have been for our game.”
In summary the current research in particular that carried out by Elliott and Weedon (2010) has contributed to the dispersal of the popular discourse that foreign players are stifling indigenous players’ opportunities to play and develop, at least within the English Premier Academy League. Further research needs to be conducted to conclude whether the influx of foreign players is preventing the indigenous players from graduating into the first teams or is it that we as a footballing nation are just not producing players good enough to challenge the foreign imports.
Part 3a of this blog will naturally follow on from Part 3 with the perceived negative effects that the influx of foreign player migration has had on the performances and development of the England national team. To offer evidence for or against these claims I will analyse the performances of the national team over the past three decades, the latter of which heralded the influx of the foreign player migration trend.
References:
Andreff, W. (2009). The economic effect of ‘Muscle-Drain’ in sport. In: Walters G and Rossi G (eds) Labour Market Migration in European Football: Key Issues and Challenges. London: Birkbeck Sports Business Centre, pp. 9–31.
Anon. (2010). In Elliott and Weedon’s (2010). Foreign players in the premier academy league: ‘Feet-drain’ or ‘feet-exchange’? International Review for the Sociology of Sport 46(1): 61–75.
Blatter, S. (2003). In Darby, P., G. Akindes, and M. Kirwin (2007). Football academies and the migration of African football labour to Europe. Journal of Sport and Social Issues 31(2): 143–161.
Blatter, S. (2008). Football Gives Hope. Available from: http://www.fifa.com/aboutfifa/organisation/president/news/newsid=741873/index.html [last accessed January 04, 2013)
Brooking, T. (2007). English football under threat. Available from: http://news.bbc.co.uk/sport1/hi/football/6975955.stm [last accessed January 04, 2013)
Darby, P., G. Akindes, and M. Kirwin. (2007). Football academies and the migration of African football labour to Europe. Journal of Sport and Social Issues 31(2): 143–161.
Del Bosque, V. (2012). Spain Coach Vicente Del Bosque Insists Foreign Premier League Players Are Not Damaging The English National Team. Available from: http://www.goal.com/en-india/news/477/euro-2012/2010/09/22/2131418/spain-coach-vicente-del-bosque-insists-foreign-premier [last accessed January 04, 2013)
Elliott, R. (2012). New Europe, new chances? The migration of professional footballers to Poland’s Ekstraklasa. International Review for the Sociology of Sport 0(0) 1–16
Elliott, R. and J. Harris. (2011). Crossing the Atlantic from football to soccer: Preliminary observations on the migrations of English players and the internationalization of major league soccer. WorkingUSA: The Journal of Labour and Society 14(4): 555–568.
Elliott, R., and G. Weedon. (2010) Foreign players in the premier academy league: ‘Feet-drain’ or ‘feet-exchange’? International Review for the Sociology of Sport 46(1): 61–75.
European Commission (2008) Press Release IP/08/807. Brussels: European Commission.
Ferguson, A. (2007). Ferguson calls for a cap on foreign players. Available from: http://www.guardian.co.uk/football/2007/nov/06/newsstory.arsenal [last accessed January 04, 2013)
Fischer, P. A., M. Reiner, and T. Straubhaar.(1997). Interdependencies between development and migration. In: Hammar T, Brochmann G, Tamas K and Faist T (eds) International Migration, Immobility and Development: Multidisciplinary Perspectives. Oxford: Berg, 91–132.
Iredale, R., and R. Appleyard. (2001) Introduction to the special issue on the international migration of the highly skilled. International Migration 39(5): 3–6
Klein, A. (1989). Baseball as underdevelopment: Dominic resistance, and baseball. Dialectical Anthropology 13: 301–321.
Klein, A. (1991a). Sport and culture as contested terrain: Americanisation in the Caribbean. Sociology of Sport Journal 8(1): 79–85.
Klein A (1991b) Sugarball: The American Game, the Dominican Dream. New Haven, CT: Yale University Press
Klein, A. (2006). Growing the Game: Baseball and Globalization. New Haven, CT: Yale University Press.
Lanfranchi, P., and M. Taylor. (2001). Moving with the Ball: The Migration of Professional Footballers. Oxford: Berg.
Magee, J., and J. Sugden. (2002). The world at their feet? Professional football and international labour migration. Journal of Sport and Social Issues 26(4): 421–437.
Maguire, J. (1999). Global Sport: Identities, Societies, Civilizations. Cambridge: Polity Press
Maguire, J. (2004). Sport Labor Migration Research Revisited. Journal of Sport & Social Issues. 28, 477-482.
Maguire, J. and R. Pearton. (2000). The impact of elite labour migration on the identification, selection and development of European soccer players. Journal of Sports Sciences 18: 759–769.
Maguire, J., and D. Stead. (1998). Border crossings: Soccer labour migration and the European Union. International Review for the Sociology of Sport 33(1): 59–73.
Maguire, J., G. Jarvie, L. Mansfield, and J. Bradley. (2002). Sport Worlds: A Sociological Perspective. Champaign, IL: Human Kinetics.
Maldini, C. (2000). In Maguire, J.A., and M. Falcous: Sport and Migration: Borders, Boundaries and Crossings
Moorhouse, H. F. (1994). Blue bonnets over the border: Scotland and the migration of footballers. In: Bale J and Maguire J (eds) The Global Sports Arena: Athletic Migration in an Interdependent World. London: Frank Cass, 78–96.
Molnar, G., and J. Maguire. (2008). Hungarian footballers on the move: Issues and observations on the first migratory phase. Sport in Society 11(1): 74–89.
Poli, R. (2010). African migrants in Asian and European football: hopes and realities. Sport in Society. 13, 1001-1011.
Poli, R. (2010). Understanding globalization through football: The new international division of labour, migratory channels and transnational trade circuits. International Review for the Sociology of Sport. 45, 491-506.
Poli R., L. Ravenel, and R. Besson. (2011). Annual Review of the European Football Players’ Labour Market. Neuchâtel: Professional Football Players Observatory.
Soldberg, H.A., and K.K. Haugen. (2008). The international trade of players in European club football: consequences for national teams. International Trade of Players. Unknown, 79-93
Stead, D., and J. Maguire. (2000). Rite de passage or passage to riches? The motivation and objectives of Nordic/Scandinavian players in English League soccer. Journal of Sport and Social Issues 24(1): 36–60.
Storey, D. (2011). Football, place and migration: foreign footballers in the FA Premier League. Geography. 96, 86-94.
Storey, D. (2011). Sport and Geography. Teaching Geography. Unknown, 67-69.
Taylor, M. (2006). Global players? Football, migration and globalisation: 1930-2000. Historical Social Research 31(1): 7–30.
Taylor, G. (2007). Meltdown: The Nationality of Premier League Players and the Future of English Football. London: Professional Footballers’ Association.
Vertovec, S. (2007). Super-Diversity in Britain. Available from: from http://www.academon.com/research-paper/super-diversity-in-britain-96649/
[last accessed January 04, 2013]
Share this:

‘Why foreign players migrate and the effect their involvement has had on English football since the inception of the Premier League’ (Part 2)
Following on from part one of this blog we’ll take a look at some of the reasons and explanations for this dramatic intensification of foreign player migration to Europe, and particularly to England.
Elite labour migration is now an established component of global sports (Maguire & Pearton, 2000), however national and transcontinental migration of highly skilled workers is not a new phenomenon (Lanfranchi & Taylor, 2001), and has become a prominent feature in global sports (Maguire, 1999; Maguire et al., 2000) such as association football. Migration in football is as old as the game itself (Taylor, 2006), and these migratory patterns have been identified as far back as the late 19th century in which heralded the inception of the Football League. However, these migrations were largely undergone by other British players from Scotland, Northern Ireland and Wales (Moorhouse, 1994). International recruitment of foreign players to England became more prominent during the post-war period, with an influx of migrants from the Commonwealth nations such as Northern Europe, Scandinavia, and the U.S, all of which shared lingual, colonial, or trading relations with England (McGovern, 2002).
Fast forward to the inaugural season of the Premier League in 1992/93 and further research shows us that during the past 20 years we have seen a dramatic intensification in the migration of foreign players to England (Elliott, 2012; Poli et al., 2011), of whom, have been described as one of the most ‘ubiquitous’ factors towards the continuing globalisation of the game within the 21st century (Elliott, 2012). In-fact on the first day of the 1992/93 Premier League season there were only 11 foreign players in the starting line-ups for Premier League clubs. Since then this number has grown exponentially, and by the 2001/02 season foreign players were the new majority. The Images that follow give a great indication of just how diverse our footballing culture has become in England over the past two decades.
There are a number of reasons that have been established for this dramatic intensification of foreign player migration to England, and they are not just limited to economic factors (Elliott & Harris, 2011). 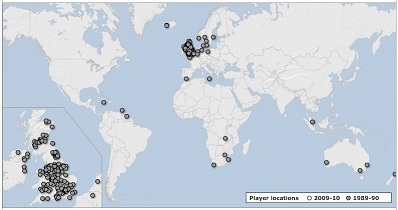 With the reinstatement of British clubs into European competitions following a ban in the late 1980’s, and the establishment of the prestigious Champions League cup competition (Maguire & Pearton, 2000), complete with its subsequent high levels of economic reward for both clubs and players we begin to see the ‘pull’ factors at work. Furthermore, the Marc Bosman European court case in December of 1995 resulted in the abandonment of quota systems allowing a greater level of freedom of contractual movement for foreign players within EU countries (Taylor, 2006), as it was proven to be in direct violation of Article 39 of the EC Treaty (now Article 45) of the Treaty on the functioning of the European Union law.
Another prominent feature of the migration followed the Taylor Report in 1990 which resulted in British football becoming a much safer environment resulting in foreign players beginning to show increased interests in migrating to England to ply their trade – which was in stark contrast to the 1980’s where British football was on its knees dying a hooligans death – and is arguably due to a dramatic influx of revenue made available through new media and sponsorship deals (Magee & Sugden, 2002) that Premier League clubs now enjoy as a result of their alliance with BskyB (Maguire & Pearton, 2000). Consequently, this had also lead to the dramatically increased and inflated salaries that professional footballers now demand. The previous has become a popular explanation amongst some academics who believe it the principle reason for migration, and describe it as the ‘mercenary’ (Maguire, 1996) desire to secure the lucrative financial rewards offered by clubs (Andreff, 2009). This desire for financial reward is, however, a more appropriate singular suggestion for migration outside of the sporting context, as highly skilled workers often migrate in order to exploit the positive wage disparities available abroad (Fischer et al., 1997).

The ‘mercenary’ desire may undoubtedly influence some players’ decision to migrate; however, it cannot be described as the only antecedent that influences these choices. Research has shown us that the practice of players ‘following the money’ (Maguire & Pearton, 2000) is part of a broader set of processes that incorporate political, historical, cultural, and geographical patterns.
There has also been a wealth of research (Elliott, 2012; Maguire and Stead, 1998; Molnar and Maguire, 2008; Stead and Maguire, 2000) that further examines the motives for the migration of foreign players, including their need to seek professional sporting experiences, coupled with the desire to test one’s ability at the highest levels – something that they cannot always achieve at the currently level offered to them in their native land. On the other hand, some players migrate only to where it is easier to become culturally assimilated, which perhaps explains why the British rarely move abroad. However, the majority of players who migrate aim to gravitate towards the core in football e.g. the Premier League or one of the other ‘top 5’ leagues in Europe.
Conversely, there are also many ‘push’ factors which force migration, including civil wars such as the many that disrupted Yugoslavia between 1991-1999. This initiated the movements abroad of many players from Croatia, Bosnia, Slovenia and Serbia (Maguire & Pearton, 2000) to Germany which is now why we see the Budesliga overflowing with Eastern European talent. Furthermore, the over-production of indigenous talent can often result in a serious lack of playing opportunities for indigenous players, thereby forcing them to leave to find pastures new to earn a living. Finally, in some cases even being expelled from a particular league or even being exiled from the country it-self has forced some players to find a new country to ply their trade (Elliott, 2012).
In summary we can see that there is a wide variety of ‘push’ and ‘pull’ factors that are not just limited to the huge sums of financial reward that have contributed to the mass migration of foreign players to European shores, but in some cases extreme events such as civil war are the catalyst. I believe it is important to understand and highlight the relationship that BskyB broadcasting has had on English football and migration since the Premier Leagues inaugural season. A tremendous amount of wealth has come from the relationship, and still there seems to be no plateau in the broadcasting rights fees. For the next three years BskyB and BT have paid the Premier League an incredible £3.018billion for the domestic TV rights, a remarkable 70% increase over the previous deal of £1.782billion, which is allowing Premier League club the license to dominate the foreign transfer markets, but although frequent are the calls for quotas systems and limitations to foreign player involvement, all in the name of ‘preserving English football’ of course. We must surely ask ourselves would we have the weekly spectacle we have enjoyed for the past two decades without the influx of these talented footballers?
In part 3 of this blog I will further analyse and address the aforementioned perceived negative effects that foreign players have had on the development of indigenous talent in this country, and will attempt to uncover whether these perceptions actually hold any truth.
References
Andreff, W. (2009). The economic effect of ‘Muscle-Drain’ in sport. In: Walters G and Rossi G (eds) Labour Market Migration in European Football: Key Issues and Challenges. London: Birkbeck Sports Business Centre, pp. 9–31.
Anon. (2010). In Elliott and Weedon’s (2010). Foreign players in the premier academy league: ‘Feet-drain’ or ‘feet-exchange’? International Review for the Sociology of Sport 46(1): 61–75.
Blatter, S. (2003). In Darby, P., G. Akindes, and M. Kirwin (2007). Football academies and the migration of African football labour to Europe. Journal of Sport and Social Issues 31(2): 143–161.
Blatter, S. (2008). Football Gives Hope. Available from: http://www.fifa.com/aboutfifa/organisation/president/news/newsid=741873/index.html [last accessed January 04, 2013)
Brooking, T. (2007). English football under threat. Available from: http://news.bbc.co.uk/sport1/hi/football/6975955.stm [last accessed January 04, 2013
Darby, P., G. Akindes, and M. Kirwin. (2007). Football academies and the migration of African football labour to Europe. Journal of Sport and Social Issues 31(2): 143–161.
Del Bosque, V. (2012). Spain Coach Vicente Del Bosque Insists Foreign Premier League Players Are Not Damaging The English National Team. Available from: http://www.goal.com/en-india/news/477/euro-2012/2010/09/22/2131418/spain-coach-vicente-del-bosque-insists-foreign-premier [last accessed January 04, 2013)
Elliott, R. (2012). New Europe, new chances? The migration of professional footballers to Poland’s Ekstraklasa. International Review for the Sociology of Sport 0(0) 1–16
Elliott, R. and J. Harris. (2011). Crossing the Atlantic from football to soccer: Preliminary observations on the migrations of English players and the internationalization of major league soccer. WorkingUSA: The Journal of Labour and Society 14(4): 555–568.
Elliott, R., and G. Weedon. (2010) Foreign players in the premier academy league: ‘Feet-drain’ or ‘feet-exchange’? International Review for the Sociology of Sport 46(1): 61–75.
European Commission (2008) Press Release IP/08/807. Brussels: European Commission.
Ferguson, A. (2007). Ferguson calls for a cap on foreign players. Available from: http://www.guardian.co.uk/football/2007/nov/06/newsstory.arsenal [last accessed January 04, 2013)
Fischer, P. A., M. Reiner, and T. Straubhaar. (1997). Interdependencies between development and migration. In: Hammar T, Brochmann G, Tamas K and Faist T (eds) International Migration, Immobility and Development: Multidisciplinary Perspectives. Oxford: Berg, 91–132.
Iredale, R., and R. Appleyard. (2001) Introduction to the special issue on the international migration of the highly skilled. International Migration 39(5): 3–6.
Klein, A. (1989). Baseball as underdevelopment: Dominic resistance, and baseball. Dialectical Anthropology 13: 301–321.
Klein, A. (1991a). Sport and culture as contested terrain: Americanisation in the Caribbean. Sociology of Sport Journal 8(1): 79–85.
Klein A (1991b) Sugarball: The American Game, the Dominican Dream. New Haven, CT: Yale University Press
Klein, A. (2006). Growing the Game: Baseball and Globalization. New Haven, CT: Yale University Press.
Lanfranchi, P., and M. Taylor. (2001). Moving with the Ball: The Migration of Professional Footballers. Oxford: Berg.
Magee, J., and J. Sugden. (2002). The world at their feet? Professional football and international labour migration. Journal of Sport and Social Issues 26(4): 421–437.
Maguire, J. (1999). Global Sport: Identities, Societies, Civilizations. Cambridge: Polity Press
Maguire, J. (2004). Sport Labor Migration Research Revisited. Journal of Sport & Social Issues. 28, 477-482.
Maguire, J. and R. Pearton. (2000). The impact of elite labour migration on the identification, selection and development of European soccer players. Journal of Sports Sciences 18: 759–769.
Maguire, J., and D. Stead. (1998). Border crossings: Soccer labour migration and the European Union. International Review for the Sociology of Sport 33(1): 59–73.
Maguire, J., G. Jarvie, L. Mansfield, and J. Bradley. (2002). Sport Worlds: A Sociological Perspective. Champaign, IL: Human Kinetics.
Maldini, C. (2000). In Maguire, J.A., and M. Falcous: Sport and Migration: Borders, Boundaries and Crossings
Moorhouse, H. F. (1994). Blue bonnets over the border: Scotland and the migration of footballers. In: Bale J and Maguire J (eds) The Global Sports Arena: Athletic Migration in an Interdependent World. London: Frank Cass, 78–96.
Molnar, G., and J. Maguire. (2008). Hungarian footballers on the move: Issues and observations on the first migratory phase. Sport in Society 11(1): 74–89.
Poli, R. (2010). African migrants in Asian and European football: hopes and realities. Sport in Society. 13, 1001-1011.
Poli, R. (2010). Understanding globalization through football: The new international division of labour, migratory channels and transnational trade circuits. International Review for the Sociology of Sport. 45, 491-506.
Poli R., L. Ravenel, and R. Besson. (2011). Annual Review of the European Football Players’ Labour Market. Neuchâtel: Professional Football Players Observatory.
Soldberg, H.A., and K.K. Haugen. (2008). The international trade of players in European club football: consequences for national teams. International Trade of Players. Unknown, 79-93
Stead, D., and J. Maguire. (2000). Rite de passage or passage to riches? The motivation and objectives of Nordic/Scandinavian players in English League soccer. Journal of Sport and Social Issues 24(1): 36–60.
Storey, D. (2011). Football, place and migration: foreign footballers in the FA Premier League. Geography. 96, 86-94.
Storey, D. (2011). Sport and Geography. Teaching Geography. Unknown, 67-69.
Taylor, M. (2006). Global players? Football, migration and globalisation: 1930-2000. Historical Social Research 31(1): 7–30.
Taylor, G. (2007). Meltdown: The Nationality of Premier League Players and the Future of English Football. London: Professional Footballers’ Association.
Vertovec, S. (2007). Super-Diversity in Britain. Available from: from http://www.academon.com/research-paper/super-diversity-in-britain-96649/ [last accessed January 04, 2013]
Share this:

‘Why foreign players migrate and the effect their involvement has had on English football since the inception of the Premier League’ (Part 1)
I’d like to begin my first blog by thanking Leo for inviting me along on this journey. I very much look forward to adding to the fantastic work he has done already. The first issue I would like to discuss is the perceived effect that foreign players are having on the English game. It’s a topic I find very interesting, and I feel is often blown out of proportion by everyone involved in the game today. The blogs that follow will be an investigation and analysis of the current state of the issue and the major views involved.
There has been a common and growing concern for a number of years amongst English football fans (Solberg & Haugen, 2008) and senior figures in world football – FIFA President Sepp Blatter, UEFA President Michel Platini, and English PFA Chief Executive Gordon Taylor – that the mass migration of foreign players to the English Premier League is having a detrimental effect on the English game, and its development of young English talent (Ferguson, 2007; Taylor, 2007). When speaking to BBC’s Inside Sport Sir Trevor Brooking (2007) stated that “you [can’t] underestimate [the threat of foreign players] and people are [only] just starting to identify it”. These concerns lie in accordance with the PFA’s ‘Meltdown’ report, which was commissioned following England’s failure to qualify for Euro 2008. Taylor (2007) states within the report that:

“The price of the unrestricted flow of foreign players into England has been the loss of a generation of English players. Indeed, we are close to losing a second generation and if current trends continue – as all evidence suggests they will – we are, at best, ten years away from having too few English players to mount a serious World Cup campaign.”
These concerns have continued to grow after England’s more recent mediocre performances during the 2010 World Cup and Euro 2012. However, some academics (Elliott & Weedon, 2010) suggest these views and concerns have been sensationalized by the British media and are in-fact not even close to the truth.
Three main arguments that have arisen from the on-going debate on foreign players: firstly, that a process of ‘feet-drain’ is occurring in English football, with foreign players stifling indigenous player development, and replacing them, or taking their opportunities for first team football (Elliott & Weedon, 2010). Secondly, that at the ‘donor’ level a process of ‘deskilling’ is occurring outside of England in the lesser economically developed countries such as Africa (Maguire et al., 2002; Maguire & Pearton, 2000). Thirdly, the migration of foreign players particularly to England is creating an imbalance in world football which is a view firmly held by FIFA President, Sepp Blatter (2008), who declared that:
“It’s not morally right, and competition loses all balance, when the big clubs buy 25 top players to deprive other teams of them and then hoard them because they can only have 11 players on the park.”
Now I have introduced this subject to you, I’d like to hear you initial views and opinions. Feel free to contribute to the discussion via the comments box. In part two of this blog I will discuss a brief history of elite labour migration, and explore some of the reasons for why we have seen this dramatic intensification of foreign player migrating to England and Europe.
References:
Blatter, S. (2008). Football Gives Hope. Available from: http://www.fifa.com/aboutfifa/organisation/president/news/newsid=741873/index.html [last accessed January 04, 2013)
Brooking, T. (2007). English football under threat. Available from: http://news.bbc.co.uk/sport1/hi/football/6975955.stm [last accessed January 04, 2013)
Elliott, R., and G. Weedon. (2010) Foreign players in the premier academy league: ‘Feet-drain’ or ‘feet-exchange’? International Review for the Sociology of Sport 46(1): 61–75.
Ferguson, A. (2007). Ferguson calls for a cap on foreign players. Available from: http://www.guardian.co.uk/football/2007/nov/06/newsstory.arsenal [last accessed January 04, 2013)
Maguire, J. and R. Pearton. (2000). The impact of elite labour migration on the identification, selection and development of European soccer players. Journal of Sports Sciences 18: 759–769.
Maguire, J., G. Jarvie, L. Mansfield, and J. Bradley. (2002). Sport Worlds: A Sociological Perspective. Champaign, IL: Human Kinetics.
Soldberg, H.A., and K.K. Haugen. (2008). The international trade of players in European club football: consequences for national teams. International Trade of Players. Unknown, 79-93
Taylor, G. (2007). Meltdown: The Nationality of Premier League Players and the Future of English Football. London: Professional Footballers’ Association.
Share this:

What is the most effective tactic to score corner goal in League 2?
In the book “Soccer Tactics and Skills”, Charles Hughes (1987) argued that the best way to score corner goal consists of 3 factors:
- Near post
- Inswing
- Keep it simple (Variety on a theme, not variety on sole criteria of doing something different)
By analysing 178 League 2 corner goals, it would be tested whether his argument can be applied to League 2 or not.
There is not much difference in terms of the sides of corner. 50.6% of corners were from the left side of the goal.

Type of delivery

The above chart shows that most of the corner goals were delivered by inswing (61%). 30% of them were outswing and 9% of them were ground pass which included medium or short corner. The finding fits the argument of Hughes that inswing is the best way to score corner goal.
Delivery target area
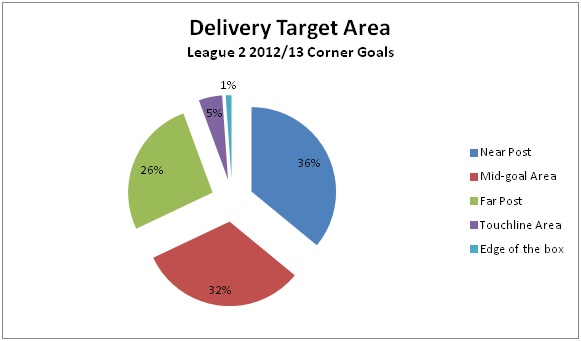
In terms of delivery target area, the result is not as dominant as the result of delivery type. Although near post was the most popular delivery target area, it was not dominant with 36%. In fact, the percentages of mid-goal area and far post were close with 32% and 26%. 5% of corners were delivered to touchline area which means they were short corners. Only 1% of corners were medium corner which were delivered to the edge of the box for long shots. By looking at this chart, Hughes’s argument about near post delivery is not very strong here because the difference between near post, mid-goal area and far post were within 10%. Near post is still a better choice but it is not a dominating factor as inswing delivery. Then the data would be compared with each other for in-depth analysis.
Which side vs. Type of delivery

The above chart shows that the preferences of delivery were different depending on which side of the corner it was. If the corner is taken at the left side of the goal, most of them were delivered by inswing. It could be explained by the fact that most of the players were right-footed. It is interesting to see which approach the team would use in the right side corner. 45 right side corner goals were delivered by inswing. That means teams chose a left-footed player to deliver the corner for the purpose of inswing delivery. However, 36 right side corner goals were delivered by outswing. This number is much more than the number of left side outswing corner (17). On the other hand, the numbers of ground pass delivery in both sides were similar. No matter which side we look at, inswing is still the most popular choice of delivery although it is more dominant in left side corner. In the right side corner, teams still prefer to do inswing delivery but there was considerable amount of outswing delivery also.
Type of delivery vs. Delivery target area

The above chart shows that inswing and near post combination scores the most corner goals (42). It fits the argument of Hughes. Another finding is that it is less likely to score corner goal at far post by outswing delivery (12 goals). The difference between inswing and outswing was less if the delivery target area is mid-goal area. The difference was 11 goals compared to the difference of near post (24 goals) and far post (23 goals). In short, for inswing delivery, it would be the best to deliver the ball to near post and far post, especially near post. For outswing delivery, it would be the best to deliver the ball to mid-goal area.
Keep it simple?
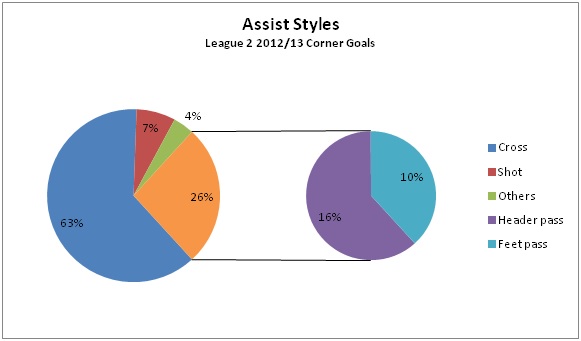
The result fits the argument of Hughes because 63% of corner goals were scored directly by the corner cross. 26% of corner goals were assisted by passing. Some teams may prefer to do flick-on headers to make assist but the data shows that it may not be a good choice because only 16% of corner goals were assisted by flick-on headers. If we consider passing assist only, flick-on header is a better choice than feet pass as shown in the chart with 6% more assists.
Conclusion
Reviewing the 3 factors mentioned by Hughes, I would say 2 of them were dominating factors in League 2: inswing delivery and keep it simple. They were proved by evidences. 61% of corner goals were delivered by inswing. 63% of corner goals were assisted by direct corner cross. However, the data shows that although near post is the best choice of delivery target area, it is not a dominating factor with 36% of corner goals delivered to near post. The same type of analysis could be applied to the data of different leagues and the results could be different.
Reference
HUGHES, C., 1987. Soccer Tactics and Skills. Great Britain: Queen Anne Press
Share this:

Northampton – Stoke City in League 2? (Part 2)
In part 1, I have compared Northampton’s performance with other teams in League 2. It was clear that Northampton was strong in set play, particularly throw-in. Over 50% of their goals were from set play. In their set play goals, around 40% of them came from throw-ins. I will focus on analysing those 13 throw-in goals in this piece.
Time Analysis

No matter we consider the throw-in goals or all goals of Northampton; they both fit the general trend of time analysis in League 2 because more goals were scored in the later stage of the game. However, the key point is about the time slot of 76-90 minutes. 29.7% of goals were scored in this time slot in all goals. On the other hand, 38.5% of throw-in goals were scored in this time slot considering that the percentages in other time slots were only 15% at most. It shows that throw-in was an effective strategy for Northampton to use in the last 15 minutes of the game to score goals.
What were the assist styles?
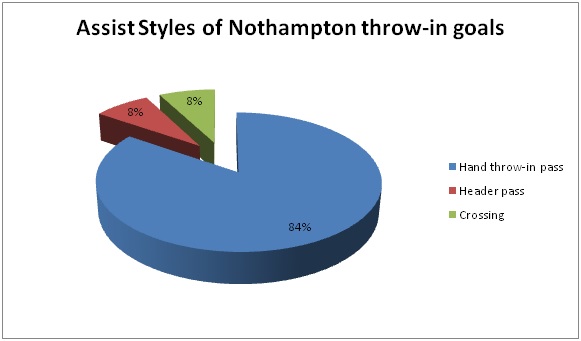
Considering the assist styles, some teams may choose to do flick-on headers to make assist. In Northampton’s case, the best way to make assist is to make a direct throw-in passing by hands. 84% of the throw-in goals were assisted by hand passes, only 8% of them were assisted by flick-on header. It also means that at least 84% of the goals were scored by one-touch shot. The technical ability to make one-touch shot is one of the keys to score throw-in goals.
Goal Type

Many people may link throw-in goals to headers but it is not the case in Northampton. Even we found out that one-touch shot is important, the above chart shows that using feet to shoot is as important as header in scoring throw-in goals. Header goals were only 8% more than feet goals. If we consider the above two charts together, we realise that considerable amount of goals were scored by hand passing throw-in followed by shots made by feet. It may be a result not expected by some people.
Where were the assists made?
Since 84% of assists were from direct hand throws, only 7.7% of assists were from central area by flick-on header. It is worthy to note that 30.8% of assists were outside 18-yard from the goal line. Some teams may only use long throw tactics near penalty area but Northampton’s statistics show that it is worthy to do long throw outside the penalty area also.
Who scored the most throw-in goals?

Northampton did not rely on any particular player to score throw-in goals as the goals were widely distributed to 8 players. A Akinfenwa is the player who scored the most with 31% of throw-in goals considering he is a striker. The other 7 players scored 1 goal each. It is worthy to note that 15% (2 goals) were scored by own goals. It shows that one of the advantages in using long throw-in is to mess up the situation in penalty area so the defenders would have a higher chance to make a mistake scoring own goal.
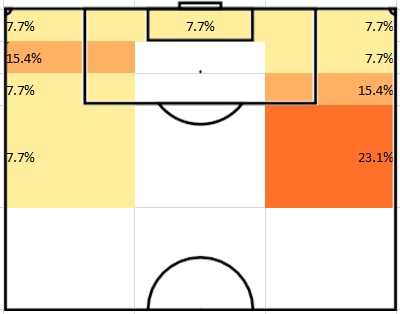
Where they scored?

The above diagram obviously shows that the prime area for attacking long throws is the 12-yard area from the goal line. 84.6% of goals were scored in these two zones. Note that 15.4% of goals were scored outside the penalty area. My explanation is that most of the defenders would try to defend long throw-in by staying at the zones in front of the goal. It leaves space outside the penalty area for attackers to make long shot. It is worthy to note that no goal was scored in 12-18 yard area. It is because this zone is neither close enough for one-touch shot in long throws nor having enough space and time for players to make long shot.
Conclusion
By analysing Northampton’s strategy in throw-ins, we can identify why they are so strong in scoring throw-in goals. Firstly, they used a very direct style to attack. They didn’t prefer flick-on header as 84% of assists were came from direct hand throw-in passes. Secondly, one-touch shot is the key to score but we should be aware that using feet to score is almost as important as using header. Thirdly, Northampton did not rely on any particular player to be the target man to score throw-in goals. They had 8 players to score 11 throw-in goals (the other 2 goals were own goals). Fourthly, don’t ignore the importance of making delivery outside the penalty area (18-yard line) because 30% of their throw-in goals were delivered from zones outside the 18-yard line.
Share this:

Northampton – Stoke City in League 2? (Part 1)
Stoke City is famous for their long throw-ins attacking strategy. It is a different kind of attack for the defenders who get used to crosses. It is also a big question for the keepers whether they should stay at the goal line or not. There are some pieces which analyse Stoke’s performance. Is there any other team having the same strategy in English football? Northampton may be the team with similar (or even better) performance in long throw-ins.
Top 5 teams in set play goals in League 2
Considering the number of set play goals, Northampton scored the most set play goals (34 goals). The following table shows the open play and set play goals of 24 League 2 teams this season and highlights the top 5 teams in set play goals. They are AFC Wimbledon, Bradford, Cheltenham, Gillingham and Northampton.

In order to analyse how important set play goals are to different teams, the percentage of set play goals were considered also. The following table shows the percentages of open play and set play goals of 24 League 2 teams this season.
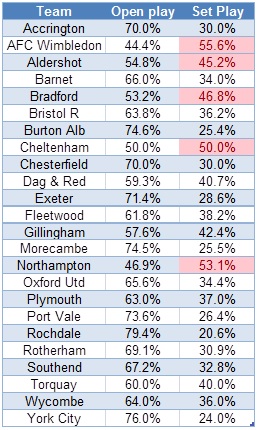
For example, being the League 2 Champion, Gillingham scored 28 set play goals but there were stronger in scoring open play goals. Therefore, set play goals only accounted for 42.4% of their total goals. The top 5 teams with the highest percentage of set play goals were AFC Wimbledon, Aldershot, Bradford, Cheltenham and Northampton. Northampton is the 2nd place in set play goal percentage. 53.1% of their goals were set play goals. Comparing both tables to each other, we can identify that 4 teams existed in the top 5 positions in both tables. They are AFC Wimbledon, Bradford, Cheltenham and Northampton. That means these 4 teams were good at scoring set play goals and set play goals were more important to them. Note that Northampton and AFC Wimbledon are the only two teams scoring more set play goals than open play goals.
Throw-ins goals in League 2
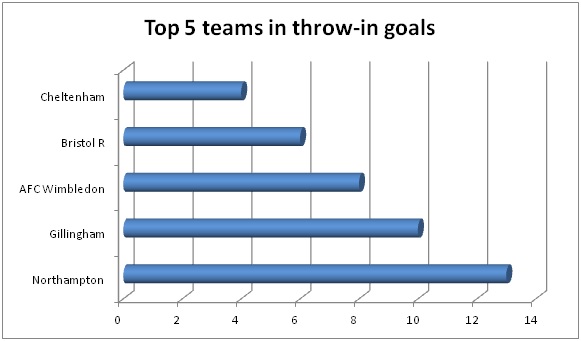
This chart shows how strong Northampton was in throw-in goals. With most of the teams having 3 throw-in goals or less, Northampton scored 13 throw-in goals this season. They scored 100% more than the 4th place Bristol Rovers having 6 throw-in goals. The great difference shows that scoring throw-in goals was a strong weapon of Northampton while most of the teams didn’t have the ability to do so.
If we consider how important throw-in goals are within set play goals, Northampton is still the team showing the highest percentage. 38.24% of their set play goals were throw-in goals. It showed how important throw-in goals were to Northampton.

In fact, Gillingham and Northampton were the only 2 teams with more than 30% of their set play goals as throw-in goals. Considering only 9 teams in the league having more than 10% of their set play goals as throw-in goals, it shows how Northampton outperformed other teams by having 38.24%.
No matter we consider the number of throw-in goals or the percentage of throw-in goals, Northampton is still the best team in the league and they obviously outperformed other teams in the league.
I don’t have the goal scoring data of Stoke City this season. However, I wonder Stoke City can achieve the two conditions of Northampton or not.
- More than 50% of goals were set play goals
- Around 40% of set play goals were throw-in goals
In part 2, the focus will be analysing the details of Northampton’s throw-in goals. It includes when they scored, how they scored, where they scored, where the assists came from, etc.
Share this:

League 2 2012/13 review: Top Scorer – Tom Pope

The top goal scorer in League 2 this season is Tom Pope, who is playing in Port Vale. He played every single game this season which means he had 46 league appearances. He scored 31 league goals. Port Vale had 87 league goals in total. Therefore, Pope has scored 35.6% of team goals. He is a tall striker with the height of 1.91m. He is 27 and will become 28 next season so he is at the peak of his career according to the analysis of optimum player age from Prozone.
How he scored?

In 31 goals, he scored 13 header goals, 9 goals by right foot and 9 goals by left foot. He is an all-round striker who can score goals through different ways. He is strongest at header goals (42%) and it is reasonable considering his height (1.91m). He is good at both feet as well because he scored considerable amount of goals through right and left foot.
Where he scored?

The above chart shows that Pope scored most of his goals in the 6-yard box (13 goals) and 6-12 yard area (13 goals). Considering 42% of his goals were header goals, it shows that he played like a target man inside the box and waited for the chances in the 12-yard area from the goal. Therefore, he is not good at long shot as he scored only 1 goal outside the penalty area.
When he scored?

The chart shows a characteristic of Pope. He was particularly strong at the 15-min period of both halves. He scored 8 goals in 16-30 mins and 61-75 mins periods. The phenomena was more obvious in the first half as he scored only 2 and 3 goals in the first 15 mins and last 15 mins in the first half.
Open play vs. Set play
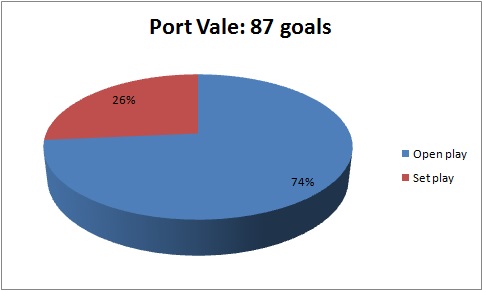
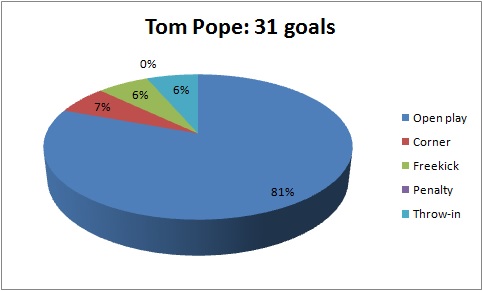
The above two charts show the comparison of the Tom Pope and the team regarding the open play and set play goals. In Port Vale team, 74% of goals were open play goals. On the other hand, 81% of Pope’s goals were open play goals. That means Pope contributed for the team more in open play goals. He hadn’t scored any penalty this season. He had only 6 goals from set play.
Where the assists came from?

The above diagrams show that most of the assists were from the flanks (67.7%), especially the left flank (48.4%). 32.3% of assists were came from the middle zones. It shows that the delivery from the flanks were more suitable for Pope to score. It fitted the previous result showing that he is strong at header. This leads to an assumption that crossing should be the main source of the assist type which will be discussed in the following chart. The reason of 48.4% of assists in the left flank could be explained by Port Vale’s strength to attack through the left flank.
Types of Assist

The previous results show that Tom Pope is stronger at header and most of the assists were came from the flanks. The above chart supports the previous findings because it shows that crossing is the main source of the assist styles (45%). The “others” assist style included dribbling and regaining possession but these were not the main source of Pope’s goal. The second main assist style was passing (26%). It was related to the following analysis about the number of touch he used to score goals.
Number of Touch

68% of Pope’s goals were scored by one touch. It fitted the previous results showing that 45% of his goals were from crossing and 26 out of 31 goals were scored within the 12-yard area from the goal. His ability to score one-touch goals is a key to his playing style as a target man working mainly near the goal. Remember he is an all-round striker who is good at scoring goals by header, right foot and left foot. It helped him a lot to score one-touch goals.
Conclusion
To conclude, here are some key statistics and findings of Tom Pope’s 31 league goals this season (2012/13):
- He is an all-round striker with 42% header goals, 29% right foot goals and 29% left foot goals
- 26 out of 31 goals were scored with 12-yard area from the goal. It fits his playing style as a target man.
- He was particularly strong at the 15-min period of both halves (i.e. 16-30 mins and 61-75 mins). 16 out of 31 goals were scored in those 30-min periods.
- He was stronger at open play (81%) than set play (19%) comparing with the stats of the Port Vale team (74% vs. 26%).
- 67.7% of the assists were from the flanks, especially left flank (48.4%)
- Crossing was the main source of the assist style (45%)
- 68% of his goals were scored by one-touch
In order to bring out the best in Tom Pope, Port Vale should provide crosses from the flanks and let Pope stay at the 12-yard area from the goal for him to score one-touch goals in the coming season.
Share this:

League 2 2012/13 review: Time Analysis
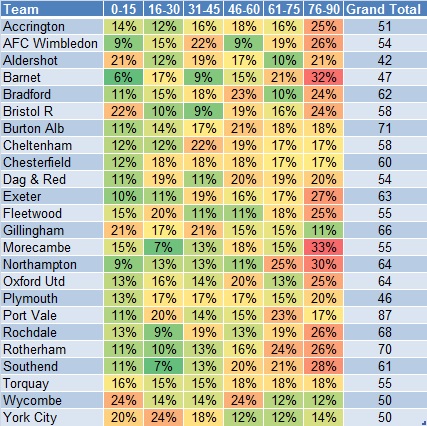
There were 1411 League 2 goals in the 2012/13 season. This article will focus on the time at which goals were scored during match play. These are important information because it shows the characteristics of different teams. I did a time analysis once in December, 2013. That result showed that there was a systematic and significant upward trend in the number of goals scored as time progressed. This time all the goals in 2012/13 season were included and the upward trend is still the same. It further supports the previous research suggesting an increase in the frequency of goals scored as a match progresses (Jinshan et al., 1993; Reilly, 1996). The methodology is the same as I divided the 90 minutes into six 15-min periods. The following chart shows when the 1411 goals were scored in League 2 this season.
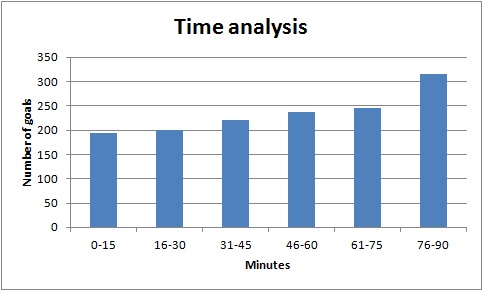
The goals scored in the last 15 minutes of the game were obviously more than other periods.
The following table shows the number of goals scored in six periods of different teams. The data were shown in a Red-Yellow-Green colour scale. That means, the higher number would be highlighted by red and the lower number would be highlighted by green for better visualisation of the data.

Gillingham, Wycombe and Bristol Rovers were the teams which started the game strongly in the first 15 minutes by scoring 14, 13 and 12 goals. Gillingham showed a special characteristic as they scored more goals in first half (39 goals) than second half (27 goals) significantly. They scored least goals in the last quarter (7 goals) which was different from the general trend of other teams which scored most goals in the last quarter. York City was another team having the same characteristic because their first half goals (31) were much more than that in second half (19).
Northampton scored most goals (19) in the last quarter but generally most of the team scored more goals in the last quarter so the difference was not significant. Port Vale showed something special as they significantly outperformed other teams in the second quarter (16-30 mins) by scoring 17 goals while most of the teams had less than 10 goals in this period.
Wycombe was a special team as well because they were particulary strong in the first 15 minutes of the halves by scoring 12 goals in 0-15 and 45-60 minutes. In other periods they scored only 6 to 7 goals.
However, if we just count the goals scored, it is not showing the whole picture of analysis because stronger teams scored more goals (e.g. Port Vale scored 87 goals and Aldershot scored 42 goals). If we want to find the characteristics of the teams, we have to convert these data into percentage which is shown by the following table.
Only 5 teams scored 20% or more goals in the first 15 minutes of the game and they were Aldershot, Bristol Rovers, Gillingham, Wycombe and York City. AFC Wimbledon, Cheltenham and Gillingham were stronger in the 15 minutes before the first half break as they had 22%, 22% and 21% of goals in that period.
Barnet was the weakest team in the first 15 minutes (6%) but they were very strong in the last quarter with 32% scored within the last 15 minutes of the game. Morecambe and Northampton were the two remaining teams which had more than 30% of goals in the last quarter. If we consider the last 30 minutes of the game, the characteristics of these teams were more significant. Barnet and Northampton had 53% and 55% of goals scored in the last 30 minutes of the game and these could be important information for their opponents.
Aldershot and Bristol Rovers shared the same characteristic as they were both strong in the first and last quarters having more than 20% of total number of goals. The team with the most evenly distributed number of goals in all six quarters was Torquay. They had around 15%-18% of goals in each quarter.
To conclude, the characteristics of the teams could be shown by having the time analysis. Some teams were stronger in the first half (e.g. Gillingham and York City). Some teams were stronger in the last 30 minutes of the game (e.g. Barnet and Northampton). These information would be useful for the opposition analysis to know the strengths and weaknesses of the opponents.
Reference
Jinshan et al., 1993. Analysis of the goals in the 14th World Cup. In: J. C. a. A. S. T. Reilly, ed. Science and Football II. London: E. and F.N. Spon, pp. 203-205.
Reilly, T., 1996. Motion analysis and physiological demands. In: T. Reilly, ed. Science and Soccer. London: E. and F.N.Spon, pp. 65-81.
Share this:

“The Invincibles” Arsenal 2003-04 Analysis (4) – Henry, Pires and Cole

How important were they?
If we consider the statistics of this left flank chain in 2003/04 season, we realised how important they were in the team. Firstly, they scored 60% of team goals. It was mainly because Henry and Pires were the top two goal scorers in the team.
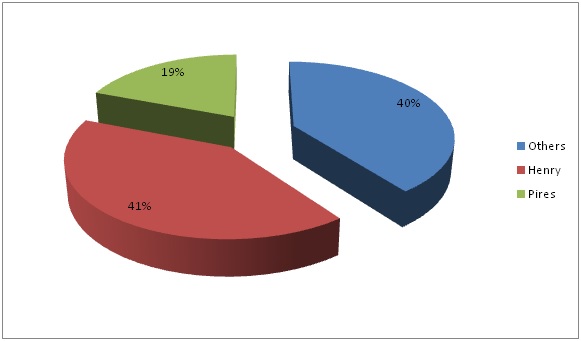
Figure 1 Goal Scorers in 2003/04 Arsenal team
Secondly, they made 49% of team assists. In short, in every two goals, one of them was from the left flank assisted by one of these three players.

Figure 2 Assist makers in 2003/04 Arsenal team
In short, it showed that Arsenal 2003/04 relied heavily on the left flank to attack. The left flank attacking combination was formed by Cole (left back), Pires (left midfielder) and Henry (left striker).
Strengths
Ashley Cole was an attacking-minded left back. He was good at crossing also. Firstly, 75% of his assists were made in the final 18-yard area.

Figure 3 Where Cole made assists in 2003/04 season
The following video shows the assists made by Cole.
This shows that he had the ability to make attacking runs to the final third frequently rather than staying in the midfield. Secondly, 50% of his assists were crossing. This shows that he was able to contribute for the team by delivering the ball into the box himself.
Pires was a left midfielder who drifted into central position by using his right foot. In season 2003/04, all his open play goals were scored in the central area. However, he was not the midfielder who scores goal by long shot in central area. His strength was to make attacking runs into the penalty area to score goals. 78.6% of his goals were scored in the central penalty area, 21.4% of goals were scored in zone 14.
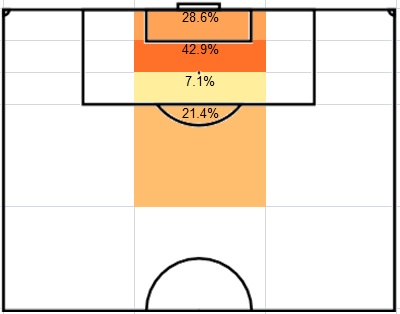
Figure 4 Where Pires scored open play goals in 2003/04 season
The following video shows the goals scored by Pires in 2003/04.
On the other hand, he had made most of the assists in central area (57.1%). Zone 14 was Pires’s active zone because 28.6% of his assists were made in this zone.

Figure 5 Where Pires made assists in open play goals
The following video shows the open play goals assists made by Pires.
All the evidences above showed that Pires was a left midfielder who attacked mostly in the central area.
Henry was strong at attacking space behind the defence. This could be analysed by looking at the assists styles of Henry’s goals. He was good at exploiting space behind the defence because the largest proportion of his goals (30%) was come from through ball. It fitted his style as he was a fast runner. For further details about Henry, please refer to the invincibles analysis part 3.
Playing Styles
All these three players were top players in 2003/04. More importantly, their playing styles fitted each other so that their combination made a great contribution for the team. Firstly, Pires was strong at passing through to the space behind defence. 43% of his open play assists were through ball. It fitted Henry’s strength because he was strong at attacking space behind the defensive line by his pace to score goals. The following video shows some examples of the combination of Henry’s run and Pires’s through ball.
Secondly, from the positional perspective, Pires tended to drift into central position and it gave more space for Cole to attack and make overlaps. The following video is an example of how it worked.
Thirdly, Henry was a striker who tended to stay at left flank. He had made most assists by crossing in the left flank. His style fitted Pires’s attacking runs into the central penalty area. The following video shows how they fitted each other in terms of their positions.

